I thought this was quite clear. If Note A is a prototype, a copy of that note is not a prototype. Or put another way, whilst $IsPrototype is true for ‘Note A’, for ‘Note A copy’ the value of the same attribute is false. By comparison, $Color would be the same for both. If ‘Note A’ were red, ‘note A copy’ would be read.
The point about ‘Note B’ is that no matter how often you copy ‘Note A’, ‘Note B’ will persist in using ‘Note A’.
Regardless, you only want a single copy of a given prototype—that’s the whole point. If you want to make a new prototype starting from an existing prototype, copy the ordiginal, rename is and then set it as a prototype (see here).
Going back to ‘note B’ using ‘Note A’ as a prototype, I sense you may think that to make another note using ‘note A’ as a prototype, you copy ‘Note A’. NO! The correct method is to make a new note, let’s call it ‘note C’—you can make it anywhere in the document, then set its prototype to ‘Note A’. If you recall there is a tutorial on how to do that latter step here.
I don’t understand what this means.
I’ve already explained a periodic table is not like a taxonomy. You are trying to create notes about plant species and want their upwards taxonomy. I’d given you a working example. Stop messing with the map for a while and use the outline I sent and add a few more species, ideally not from the same genus, i.e. so you start to branch the outline.
Actually, a better way to put it is they are different views of the same thing and visualise different relationships and enable different functions.
Outline is the canonical view and the represents how the notes are stored. A map showing only one container in the outline. Hyperbolic view shows the whole document but only for notes that are linked to other notes, and so on.
I understand that the prototype part of the note does not duplicate in relation to the prototype settings. So, I have to change some identifying feature of the note to make a new prototype. I also have to check off generals/searchable and generals/bequeathchild… in the get info box. I forgot to say that. I think you are saying that there is no point in copying a prototype because anyway all of the parameters need to be reset anyway. If I am talking about a column, than this may not be true.
Since I am actually talking about a column that shares some aspect of each element within it, then copying makes sense to me.
I am talking about a table because that is the actual arrangement of my data. You understand that the terms are biology, so you made my project into a genealogy, but the need I have is to keep track of clinical evidence. A strict genealogy will be insufficient. The table uses genealogical information, but the layout of the items used to track the information is not a genealogy in the strict sense that you are referring to. The already thought out form for this data is a table. I am not making this up as I go. It is a system that already exists. I want to set up the prototype and then use it to make relevant notes easy to collate.
(One note could easily refer to several prototypes. I have a feeling that this is not how a prototype is used. If my feeling is true, then we should stop talking about prototypes. Or maybe I should think of notes as nested elements that are actually difficult to read in the map form, but maybe there is a easier way to read them. I am also thinking that I should keep my notes in Devon Think and use TBX as a way to collate them, but not as a way to read them.)
That is why I started asking about a table. The original information comes from a Linnaeus-type genealogy, but that is not the form that I am working with. That is why I am asking about rows and columns. But, your point is well taken. I should work with what we are both understanding. Still my question remains.
To make a prototype of a table, I think I am supposed to break my table into an outline of rows and columns. Any element (could be a plant or a mineral since both are used as medicines) could be found either within the rows, or within the columns. (That is my clinical data system not a genealogy). Plants are much more complicated than minerals, so they have more identifying elements (family, class, subclass). That means that within the same prototype container, I guess I would have two parts to the outline: the plant and mineral parts.
Furthermore, on the table system that I am using, Family, class, and subclass are not notes within notes. Each is like another smaller spreadsheet. That is the design is flat. They are within the same container as rows and column, but as identifying features, they are not notes within notes. (Remember other people who I work with, do not have TBX so they need a system that does not involve something as complicated as a genealogy to layout the data. Numbers are used to identify the categories just to decrease the verbal clutter. Also, to increase order. That is why and how a spreadsheet is used. It is a flat design and not nested) In the system that I am using, minerals and plants are based on the same spreadsheet format. I think you are saying that I would need to redo the same process of making columns and rows of the plant and mineral spreadsheets. I could not copy the mineral spreadsheet and add the complexity of the plant spreadsheet. But, in the clinical evidence chart, the columns and rows of the element are copied in fact. Physically it is difficult to place plants and minerals on the same printed page, but conceptually, for the system that I am using, they are ¨in¨ the same spreadsheet.
Other factors such as cause of disease are integrated too.
In short, totally separating the plant and mineral elements is not ideal for my project because often what I am trying to see is the relationship between plants and minerals. I really want the elements of the mineral that are the same as those in the arrangement of the clinical data about plants to use the same prototypes. (Those aspects that refer to columns and row.) I do not understand why I could not do that. The plants would need other elements that would be evident in the outline of their spreadsheet, but the column and row aspects should be re-used, at least conceptually. That is I would refer to the columns and row prototypes that are al ready available in the spreadsheet for the minerals. That would be less work, but more important, more useful for me because it is the original design used to store this clinical data. That is it is the actual design of the system that I am using. It is not conjecture in the sense that I am planning to discover it. Is this impossible in TBX? I am not asking you to do the work for me. I am asking if the concept is possible.
Sorry to be so inflexible and apparently stubborn, but I actually have something that I want to do in TBX. If what I want to do is not possible, then probably I should not try to use TBX.
It is early morning in Japan. There is plenty of time to work on the computer and walk in nature. Today it will rain, but the birds are singing anyway. Hope your work is going well.
You say this table is real but all I see are some numbers and a description that doesn’t reflect that layout. My botany degree may be back in the last millennium but your headings imply a taxonomy†. For instance, if Phylum 1 is the descendant of Kingdom 1 and Phylum 2 of Kingdom 2, from what does Phylum 5 descend? Your model doesn’t explain that.
† Genealogy has nothing to do with this. Let’s try to get uor terminology correct or things get even more confusing
No! It uses taxonomic information, which is an outline in terms of of how a species’ ancestry is derived. My model showed a single species but gave you easy building blocks to make more, which would lead to a more complex outline once finished. Though this is only part of the overall file, it is the easiest way to make per-species note items with all the ancestor info you say you nee. Once done you can move them into a map, or alias them as the ancestor information will be correct and won’t change.
Actually, no. A class is a taxonomic descendant. In terms of storing a note, you don’t have to to store the one within the other. But, to capture the taxonomic information you want, an outline is a good way to capture and set ancestral properties. By all means move the notes once that data is added. Think of the notes as leaves growing at the tip og a branch (of the outline). Once the leaf is grown you can detach them and put them in a pile, e.g. all on the same map.
I’m confused as to how and why you need a prototype for what you refer to as your table. The prototype lets one note (the prototype itself) seed attribute values to any note(s) that use it. The more notes that use a prototype, the more effort you save. If only one note will ever use a prototype, you don’t need a prototype for that purpose. Your ‘table’ consists of many cells though it seems unlikely each cell needs a prototype, not least because all the ‘cell’ in the table are different.
Now I’m truly confounded. How, as per your table, can you have a phylum of rock? Much as I’m trying to to help, the frame of reference and terminology keep changing. I think the underlying problem at this point is you don’t yet have a clear and unambiguous description of what you are trying to do, conflated with inconsistent terminology. Please don’t misread that as me suggesting you don’t know what you want to achieve. Not at all my point. Rather, it is articulating that idea with sufficient clarity so we can give you helpful advice.
So, it might help you if you spent a bit more time making a better descriptive model than the current ‘table’. A bunch of numbered spreadsheet cells don’t explain what’s going on especially when mixed with headings that don’t seem to fit the scenario being described.
I’m not sure there’s anything else I can practically suggest at this point, though if there are some smaller-scoped more practical questions, I’ll be happy to try and answer them. Late here, so I’ll finish now.
I am sorry. I am not using the correct terminology. I have never studied botany and I am making up terms. Part of the problem arises from the fact that I am not doing botany. What I am doing is hard for me to describe since it is new to me also and probably not within your experience either. It is a form of alternative medicine, and within that field this is very innovative work. So, I am trying to figure it out as I write to you. I am not the creator of this system, I am writing notes trying to learn the details of the system.
Returning to the spreadsheet idea of let’s call it a “periodic table” without getting into a technical discussion. I want to be able to find items on the table from rows 1-7. (and columns 1-18) I am looking at a demo by Stephen Zeoli.
Following Steven Zeoli’s example, I would create notes for each row and then create stamps to find them. That seems like too many steps since I would do this repeatedly.
Also, the problem with using this method for Columns on my table is there are 18 columns so, I will have trouble just in terms of space on the stamp window.
Prototypes and Stamps is probably not a good way to achieve my goals.
I thought of searching for text. So, if I start the search term with a weird combination of letters such as xycolumn1, to bring up all the notes containing that term. I found this way of searching in another discussion. $Text.contains(“\xxx\b”) So I would substitute xxx with my own invented term, xycolumn1, to find all mentions of column one.
Really, I am looking for the intersection of the row identifier and the column identifier. Maybe there is a way to search for the overlap of notes that are described by two terms.
I am not sure where in the TBX interface I would do this search and what the operation is called.
If this worked, many of my problems would be solved.
I hope this is a clearer description of my problem. You said somewhere that TBX had no system for searching for text. So, maybe this is also impossible.
Please don’t ‘just’ re-use definitions out of context as they just confuse those who do understand them and make it harder to help you as the resulting explanations of your process don’t make sense due to the terminology.
Re Steve Z’ nice demos, viewers please note the query syntax is wrong (supported for legacy only). To test $SomeApp has the value “thing”, i.e. ‘equals’, use == and not=. Use the latter only for setting an attribute to a value, not as an equality test. See ‘= (assignment)’ as opposed to ‘== (equality)’.
If you are going to make a fixed grid in a map view, you can make two user attributes of Number data-type. Call them ‘Row’ and ‘Column’. For each note in the grid, set the relevant values. so for row 2 column 3, $Row would be set to 2 and $Column would be set to 3.
To use an agent to find all notes from row/column 1,1 through 7,18, use this query:
($Row > 0 & $Row < 8) & $Column >0 & $Column <19)
i.e. $Row is greater than zero AND less than eight AND $Column is greater than 0 AND less than nineteen. The 'AND (&) joins mean all 4 conditions matched be true for a note to be matched.
You can’t use a stamp for this as stamps essentially set things whereas you are asking for match/alias things.
The above notwithstanding, I suspect you would gain massively by stepping back from the computer and drawing out the ‘grid’ on paper and naming all the parts. that way you are building from a known design and not getting confused as to what is your intent vs things done by the app.
I am going back to previous help that you kindly gave me now that I seem to have found the instructions for what I need to do (TBX/Menu/Help/Actions and Dashboards), I should be able to do this.
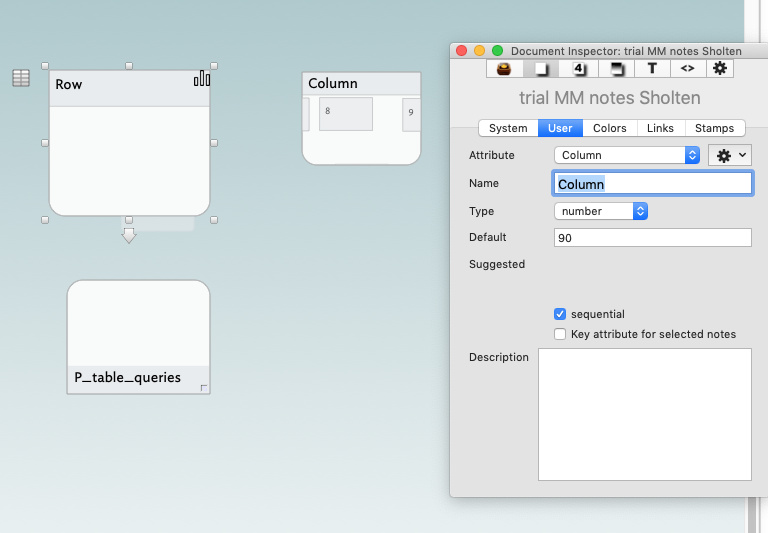
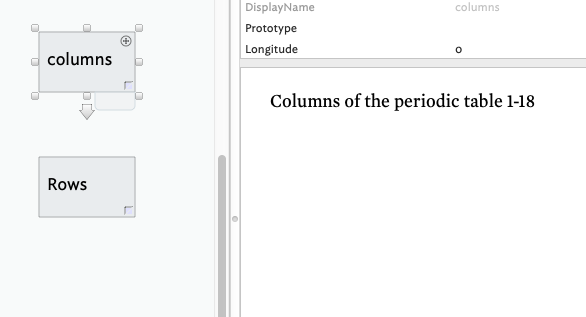
I am trying to set up a query to find an element in an arrangement of notes similar to the Periodic Table as you described above. The prototypes for $Row and $Column appear in the drop-down list for prototypes. If I get column set up as numbers (Info/Document/User) , then $Row that I previously set up in the same way disappears.
From your second screenshot … it could be so many things. Could you please upload a TBX showing your problem. It doesn’t need to be your full work, just a small TBX showing the sproblem you are trying to solve. We need a common frame of reference. You can upload the TBX by drag-drop from your Mac’s Finder onto the message drafting box.
By ‘column’ I assume you mean the attribute Column? If so, it is important to remember that attribute names are case-sensitive. In code (action, queries, etc.) column and Column would refer to two different attributes.
Disappears from where? I’m sorry, but it is very difficult to follow what you are doing without a fuller description of what is going on. This is why I suggest you upload an example file so we have a common frame of reference.
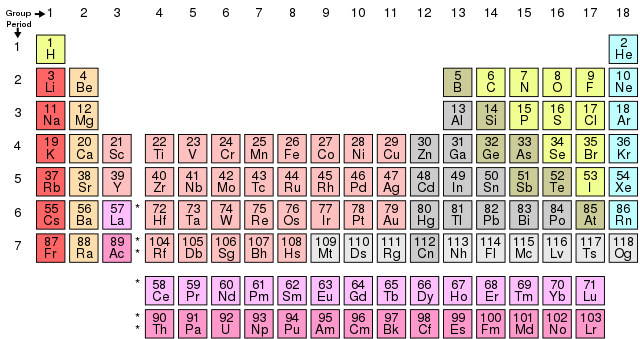
Thanks for that. I first observation is that conceptually rows & columns as an address only work as part of a grid of notes. How a container of ‘row’ notes and a separate container of column notes won’t work. By analogy, your TBX is arranged as if to have a spreadsheet with two sheets. The first has many rows and one column; the second, many columns and one row. You keep using the term ‘periodic table’, i.e. a grid like this:
If you are not using a grid, then using the term ‘periodic table’ is very confusing to those of us trying to help you as we imagine a layout like above and yet that is not what you appear to be making (I’m referring not so much the the current small tests, as in the overall thread)
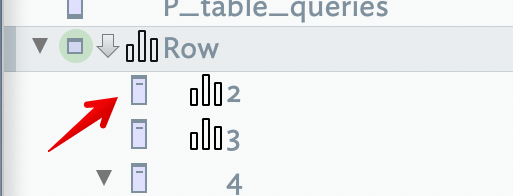
Why do the numbered notes in the rows and columns use a non numerical sibling sequence? What is the logic of this?
Placing a note inside a prototype has no effect of itself. From your file:
What were you trying to achieve here with the nesting? Were you assuming the notes in the container would inherit from the prototypes? If so, that’s not how prototypes work. See this tutorial on prototypes and inheritance.
Your agent query doesn’t work as you have not created attributes for rows & columns ($Rows & $Columns). Thus you can’t test for values of them as your agent query tries to do:
($Row > 0 & $Row < 8) & $Column >0 & $Column <19)
In the above you have also failed to check your parentheses are properly pairs: you have one opening parenthesis but two closing one. This may well cause the query logic to not work as you desire. Always balance parentheses. I suspect you meant:
Unless you are using minus or zero row/column value, it would be easier to write the above as:
$Row <= 7 & $Column <= 18
Even then, as you only have rows 1-7 and columns 1-18, it seems like you want all items in the ‘grid’. That would be easier if they all used a common prototype or a user boolean (ticked for grid notes). As it is this would probably work:
$Rows | $Columns
N.B. this won’t work in your test file as these attributes aren’t defined. If they were, the query would match all notes that either has a non-default $Rows value OR and non-default $Columns value. Indeed, as this is a grid, any grid note would need both a row and a column value so testing the second in superfluous and the last query above could be made more efficient like so:
$Rows
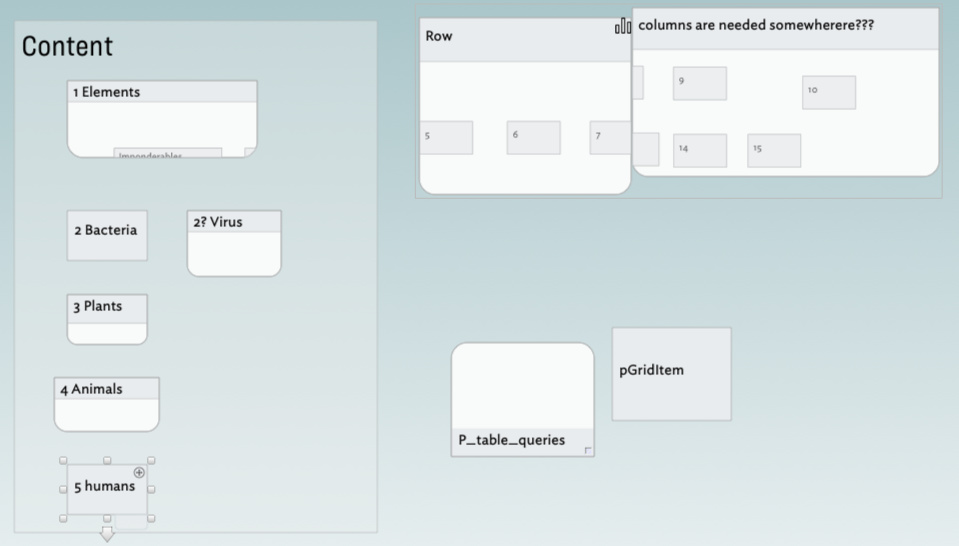
Better might be to have a prototype ‘pGridItem’ that you apply to all gird items. Then you can use the query:
$Prototype=="pGridItem"
To find all gird items. Thus to find all items in grid column #4 (assuming you’ve made a $Column attribute):
$Prototype=="pGridItem" & $Column==4
Try fixing some of these issues and re-posting your solution in another small TBX. Having an example TBX to work from here has been most useful if getting a gauge of where you are.
Another things you might consider. Do you have the grid drawn out on paper. If you could link to a photo of it (or upload one) that too would be helpful in gauging how your TBX is representing your (data) model.
Here is the table that I am using. It is slightly different than a periodic table because it is designed to describe the clinical use of medicines
Yes, I am making the mistake that you are citing. I am trying to find a way to “collect” all notes containing for example "$Row1. Not just the intersection between #Row1 and #Column1 but also, any mention on of $Row1 alone.
My content is actually nested. That is because contrary to your expectation that a table should only contain elements, my table contains all forms of life and energy (Plants, intangible light, chemicals, animal products…). Especially the Plants are deeply buried in nested notes.
This is confusing to me and that is why I am trying to use TBX to lay it out as I am studying it. You see the numbers in front of each plant group name. That is part of the system describing where it relates to the $Rows on the Table.
Of course, parenthesis needs to be in pairs. I will follow that rule.
I think you are referring to Default below that could be 0 if the new attribute were not a number.
I marked Column and Row as number attributes at Info/document/User
Note 4 is a reference for $Column==4 It has number user attribute.
In the query note I opened Gear icon/Query thinking I could paste your query above. Not possible. So, I tried Gear icon/Action I could paste in your query, but no result when I opened sort. I tried sorting because that is what I saw in Queries and Documents. Looked at sorting. I want note 4 alias to appear in the query note.
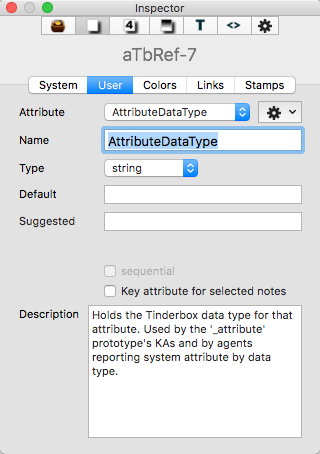
Thanks gain, the picture and files are a great help. To avoid too long a post, I may split this replies into several parts. The first part is about one of the building blocks. Above you show the Document Inspector’s User tab and appear to be trying to use it to set per-note values. This is not quite how things work with get/setting attribute values.
create new user attributes and configure settings related to them (data type, default value (if any), etc.)
check/alter said details after creation
delete a user attribute (not all per-note values for that attribute are also deleted)
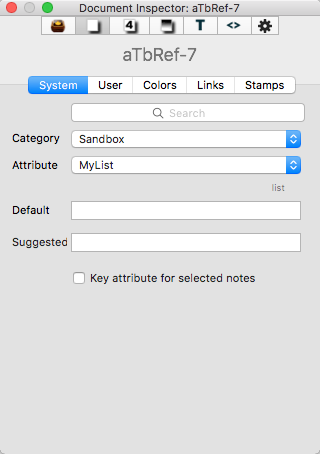
By comparison, this is the Document Inspector’s System tab is shown here:
By comparison, this lets you view (built-in) ‘system’ attribute details. All notes ‘have’ these attributes from the moment you create the note; even if you never use them, or view then, they are still there.
For system attributes you can set a different default value to that set at document creation, of (for some data types) give suggested values. Unlike user attribute, you can’t delete a system attribute, rename it, or change it’s data type (all things to do with care, even where you can!).
So we use the Document Inspector’s User tab to create an attribute ‘Rows’, that I’ll now refer to as $Rows. There are 5 ways to do this. I won’t number them as all are equally correct:
Get Info/attributes tab, either as a pop-up or tear-off window. A value edit here affects only the current note.
Properties Inspector Quickstamp tab. A value edit here affects all currently selected note(s).
Apply a Stamp. A value edit here affects all currently selected note(s).
Action code (OnAdd, Rule, Edict, Agent Action. This sets whatever attribute(s) of whichever note(s) are in scope. N.B. a stamp is essentially a snippet of action code.
Note the first 3 all offer a search box (for Key Attributes in the KA configuration pop-over), so as long as you know the name of all/part of an attribute you can locate it without needing to know in which attribute Group is live, noting all user attributes are always in the ‘User’ group. If still unsure, aTbRef has an alphabetical list of all system attributes.
The most popular methods for working on attribute values appear to be Key Attributes and the Quickstamp. Note the thread here about Key Attributes and be aware the ‘Key’ part simply means you, the user, think those attributer(s)—of all those available—are worth having visible in a note’s text pane. Adding or removing an attribute from Key Attributes has no effect on that attribute’s value.
Also wonder if you have not been confusing the Document Inspector (System and User tabs) with the Properties Inspector (Quickstamp tab). Recall the first configures the attribute itself for the whole document, whereas the second sets the attribute’s value in all selected notes (i.e. one or more notes).
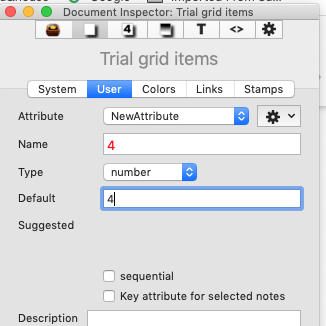
But you illustrate (ignoring the attribute name) the Document Inspector User tab with a Default value of ‘4’. That sets the attributes into value to 4 for all notes in the document. Hopefully my explanation above will show you why this is wrong.
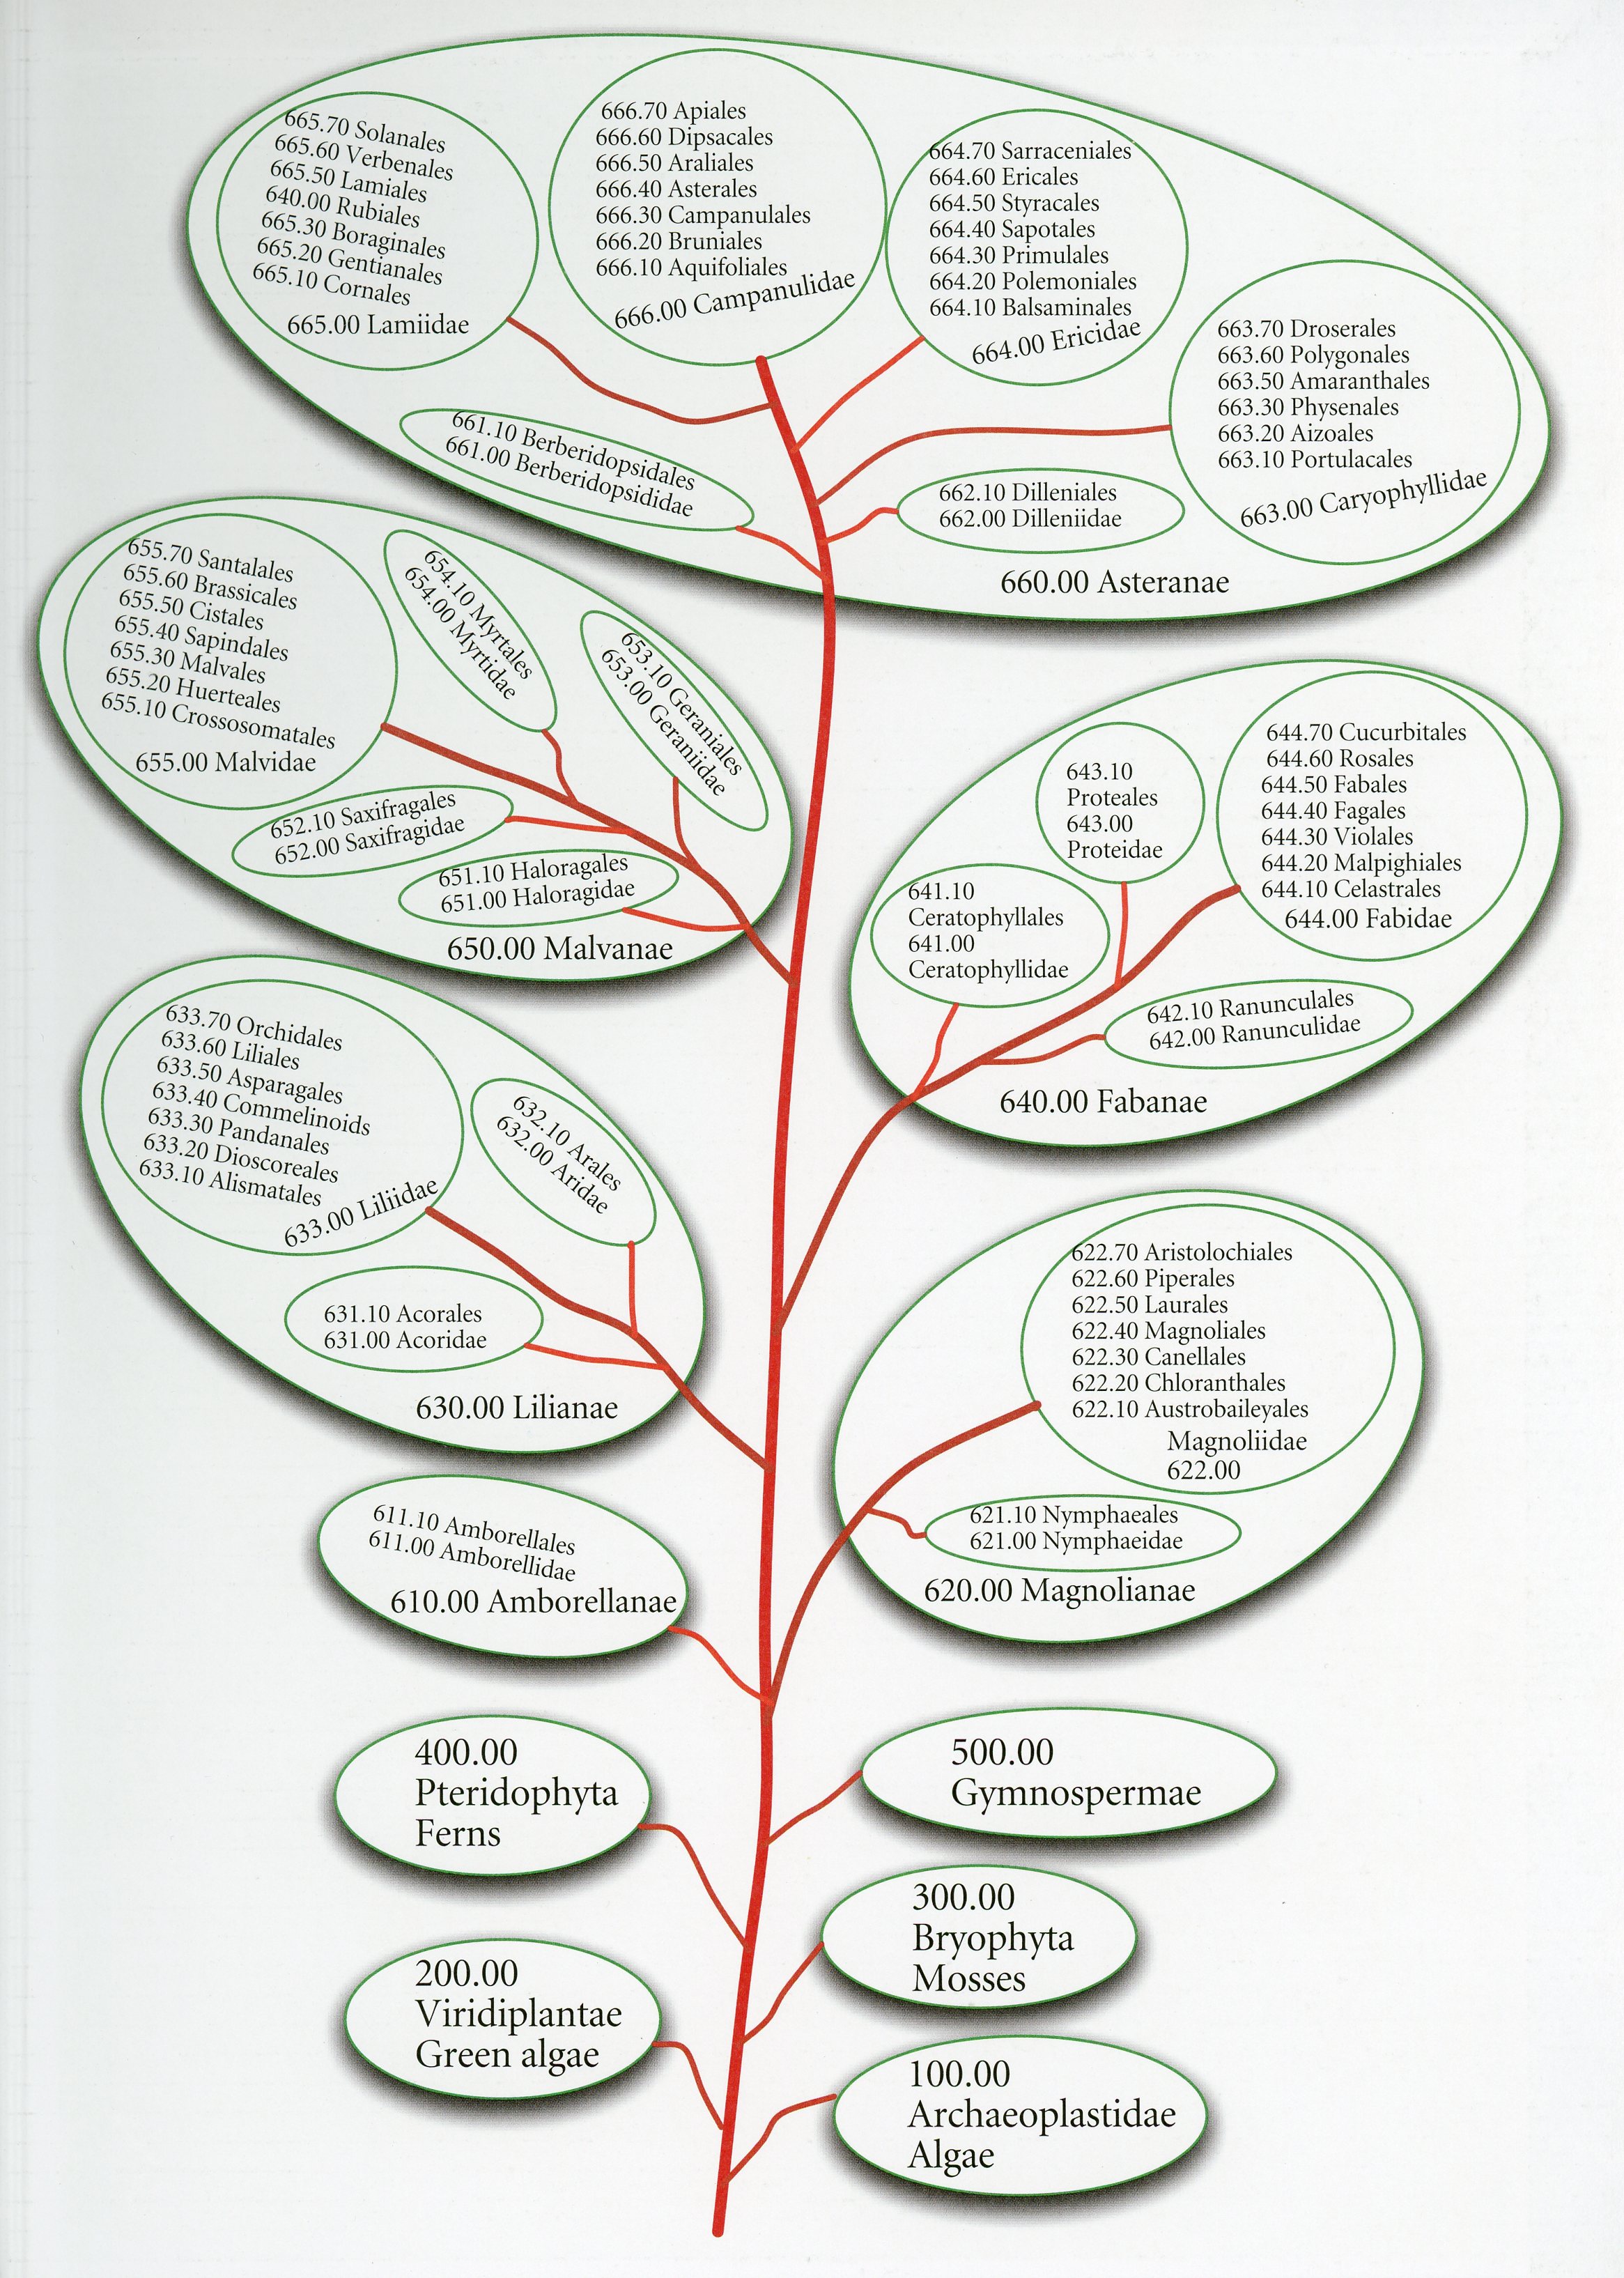
The diagram you’ve shown is definitely not structurally a grid and would normally be described as an outline. In deed, exactly the sort of thing I did in my original demo for you a while back.
I still don’t set any rows and columns in that diagram, but I do see a 3-level outline.
I’ll return to the rest later, as I have to go out now, but thanks for the new TBX (which I have downloaded.)
OK, the “Trial grid items.tbx” is confusing. References to a query but no agent.
You have created $Row and $Column, but why have you set a default value of 5? To help it is important to understand what you think that change did.
You have a note called 4, but the $Row and $Column are both set to a value of 2. Yet your notes refer to a query of:
$Prototype=="pGridItem" & $Column==4
This will never find note ‘4’ because it needs to match. However, if I add an agent and set the query to:
$Prototype=="pGridItem" & $Column==2
The agent matches note 4. See this amended TBX, Trial grid items2.tbx (93.9 KB), which demonstrates this. I’ve deleted the map view tab as it is simply confusing things at this point. Until you have a comfortable grasp of how the attributes function, I’d suggest working in outline view, especially as the data structure in your earlier screen grab isan outline and won’t neatly flatten into a map.
You cannot imagine how meaningless terms like the system, document, stamps have been to me. I had a hard time following what you said to explain them, but I think I got it.
Usually when I look up something, it is explained one at a time. The relationship to the whole is never evident and I just get lost.
Stupid details help me to get lost. For example, the Key Attribute pop popover is accessed through the plus sign on the upper right corner of the text box for a note. I do not know this. Add Displayed Attributes pop-over Instead of following the explanation in the text, I am asking how do I access that on the note? What is it for? What is the name of the popover? I know they are obvious to you, but to me, I need at least a name so when I forget everything you have told me, I can go back and look it up. If there were even a bubble the came up when I hovered the mouse over the plus sign, I would begin remembering what it is called and maybe its purpose. The next step is to answer what is it for?, but first I need a way to look up the information. This is all unfamiliar, so I will not remember it all. I look up explanations many times and sometimes make a little progress. Sorry. I am just not that smart about programs.
Also, the possibilities in a list that you kindly provided is helpful. I am trying to decide how to use TBX for my purposes. With no list of the possibilities, it is hard to decide what I should be doing. Honestly, I am unable to make that decision, but anyway, I am trying. Through comparison, the structure is a little clearer.
I am telling you this not as a complaint. It is clear that you are trying to get even people like me using TBX as more than pretty boxes. I deeply appreciate your effort.
The plant taxonomy is a three-level outline. In fact, it is not used as a 3 level outline. The levels are given numbers. They are explained to me as $Row and #Column as you would find in a table. For example, the 660.000 Asteranacea are all in row 6 of the table. 650.00 Malvanae are above the Asteranacea in row 5. Rows 6 and 5 have meanings that are coherent with the table of elements. Within their respective rows, each plant sub-group is described in a more elaborate way that does not even boil down to a simple outline. Relationships are made with notes that are not on the table. I will make links to other parts of my document to overcome this complexity. Nonetheless, the row and column of each plant family is a very important part of the identity of each plant subgroup under it. The practical purpose of this complexity is to use the overall system to find curative plant-medicines. There are many other methods, but this is the one that I am trying to learn through TBX. I am told to master the element chart system that I showed you and then use that to understand the structure for the plants. I think TBX would be able to organize this complexity, somewhat. Otherwise, I am using DEVONthink to look for words that are less systematically organized.
I am sorry, but I do not understand what 2 refers to. I erased what you did by accident and tried to recreate it as “Find Column 4”. I see lots of numbers in the infrastructure, but do not understand what they refer to.
I see many numbers and they are all without references for me.
In pGridItem the query has has become an action.
So, how do I pull out note 4? Or maybe I don’t have to do that. It would be ideal if I could associate a note with the prototypes $Column or $Row and a specific number 1-18. Then if I could use a query that collects the notes associalted with the column or row that I supecified I could put my content notes on plants in the 3 level outline that we discussed and the problem would be solved.
But, the purpose of all this is not to just build the situation so that a query could be converted to an action. The larger goal is to figure out how this happens so I can apply it to a different situation.
The ‘2’ is a literal value, i.e. the value of an attribute. Thus the query:
$Prototype=="pGridItem" & $Column==2
matches a note whose prototype is ‘pGridItem’ and whose ‘Column’ attribute has the exact value of ‘2’. See documentation for the meaning of the ‘==’ operator).
I’m confused by your ‘Trial grid items2 (4).tbx’. You have pasted in the above query to the agent but as the document† has no ‘pGridItem’ prototype defined (so there are no notes using such a prototype). OK, let’s simplify things and remove the prototype part of the query. In fact, I’ve removed the most of the extra notes from your example TBX and the map‡ view tab.
In the following file, I’ve changed the agent query to:
$Column==2
What does the agent find? Please report.
Next, change the agent query to:
$Column==11
What does the agent find? Please report.
Lastly, change the agent query to:
$Column==7
What does the agent find? Please report.
† a ‘document’ is a discrete Tinderbox file. These usually have a ‘.tbx’ file extension when seen in Finder. N.B.: the Tinderbox can open more than one document at at time, but fewer users will likely do/need this. It can be useful though when making a small test file to try out a technique that isn’t working in a larker work document. For instance, for checking/copying structures into the work file or vice versa.
‡ Until you understand the real basics Tinderbox, and reflecting the challenges to understanding you describe, I strongly suggest you don’t use map view as it will only confuse you. Others reading this should not be dissuaded from using map view—this is direct advice to one specific user to help them get started.
Ouch! I thank your later note that your observation isn’t a complaint. But, I’m unclear how to make the tool much clearer. For instance, I gave links to all the terms above, but if you don’t understand the linked information, why don’t you ask? If you read a linked article, tell me at which point you got stuck. I can’t write aTbRef for an audience of one (aka personal tuition) but I can fix structural errors if people can articluate what they are. “Don’t understand” doesn’t help in that regard. “I read something on URL of webpage but what does some term mean?” is something I may be able to fix.
I don’t accept that Add Displayed Attributes pop-over. This pop-over is opened from two different places using two different form. Both those are linked.
At the linked page Text tab * Add Key Attributes (‘+’) button. This opens the [Add Key Attributes] it says “(Add Displayed Attributes pop-over) pop-over, allowing addition and editing of the Key Attribute table.”
One aim of hypertext documentation is not to write the same fact several times over. In a knowledgebase like aTbRef where the app is under continual improvement/fix then if something alters we fix it once and not in N different places. The latter is a fool’s errand.
So, having read all the linked pages above, where—from the reader’s perspective—am I making an error? The question is not confrontational. I write aTbRef to help other users—such as yourself; it is also a meta-exploration of the challenge of documentation of complex tools in hypertext form. so, it’s been a learning experience since I started in 2004, and I’d like to think it has got better over time, not least due to actionable input for its readers.
Except they are not, at least not in the diagram you kindly posted. Could you perhaps post a picture -or link to something that does explain this mapping.
To me, and one who—albeit c.40 years back—trained in the Linnaean classification system, it still looks like an outline and not a simple ‘grid’. If I had to guess the outline level ($OutlineDepth in Tinderbox terms) in your digram might map to column, but it would help yo understand the rubric for that.
This is part of the genuine challenge in knowledge exploration tools mapping a minds-eye imagining onto the more hard-edged reality of the data at hand. I’m not sure that’s properly resolved yet for your data model. But, don’t think it can’t be. Sometimes hard things take longer than easy things. Been there…
How is the reader going to guess where the (‘+’) button is. There is no reference to the page that the window comes from. I still don’t understand the picture on Add Displayed Attributes pop-over. It says the “current note” but where on the current note? The box before it is opened? The map view, or the text box? You probably have a clear definition of what you mean by current note, but I don’t. If you showed a picture with an arrow pointing to the plus sign, the rest would be obvious. I am probably the only person in the world who opens the plus sign and sees something that is very different from what is shown on your page. I don’t know how this operates, so I am confused. If you showed a picture of the plus sign, even if the opened window looked slightly different Add Displayed Attributes pop-over, I would think that I have located the object of the discussion.
I open the above page thinking what is a Key attribute? Somehow I am linked to Displayed Attributes table
This is a sample note, so I have never seen a table like this and am not sure how to make one.
The definition of a Key Attribute appears to be this sentence: "A note’s ‘Key Attributes’ are an optional display of a user-defined tabular layout of attribute title/value cells. Attribute names are in the left column, values in the right column; from v8.2.2 the width of the first column of the key attribute table now adjusts itself to accommodate long attribute names. The list can be re-ordered, items deleted and attribute value edited. "
What would I underline in this sentence to define key attribute? I don’t think it is a “display” or a “layout” Somehow, I don’t think I find a definition of the term. I suppose definitions are in another part of the explanation, but I don’t know that either. I googled “key attribute code”, and found that it is a computer coding term. But, I did not find a definition. Also, In this manual, I found no page of terms defined.
Really, I would not be searching around for a definition of terms because there are too many terms like this. In a sense, you are speaking French and I do not know French. Probably, if I were born in the computer age, I would be speaking your language. Groan. I am too old. Can’t fix that.
Take heart, Tinderbox and your explanations must be much better. Because when I started trying to learn Tinderbox is around 2012, I was much more lost than I am now. Then I was overwhelmed by the whole idea. Now, I am sick and tired of paying for upgrades and using TBX as if it were a tinker toy set. I know that what I want to do is possible.
A few more pictures placing the explanation in the physical context of the Tinderbox would not be a huge loss to you. If I understand the physical context, I can click around and situate myself a little better.
Also, your pictures of concepts are extremely helpful. That arrow drawing of Tinderbox-the system-a document-a part of the interface such an action and specific note certainly left an impression. I am not reproducing it correctly, but I got the basic idea. Different aspects of the program work at different levels.
Links that explain everything to you, leave me out in the cold because I do not understand the context. Mainly I am worried about how that explanation affects what I can do with TBX. So, I am stuck at the level of looking for the popout, etc that you are referring to.
Mark you asked, so I will try to explain. If I sound crazy or just unintelligible, please forgive me. I don’t really expect you to get it. Even in my field, what I am learning is pushing the envelope.
I sent you two photos. The table of the elements is the graph that I have been given. The Linnaean classifiction system is another photo. That works for plants, but the basic system that I am being taught to use is the table of the elements. The table of the element starts at the top with the smallest and most simple elements (Hydrogen and Helium). That is row 1. By the time you get to row 6, you have to deal with much larger elements. For elements, row 6 is divided into three parts. There are so many of them. In the history of the universe, these bigger heavier elements are newer.
If you place the Linnaean tree upside down on the table of elements, the most simple forms, algae are at in row 1. As the plants become more sophistocated, they also take on more forms. In terms of evolution, they also are newer.
Looking at the photo of the plants, each plant has a number before it. Between 100.00 and 500.00 the plants are more primitive. 620.00-650.00 are located in rows 2-5 respectively. Remember, the tree is upside down on the table. 660.00 suddenly becomes a proliferation of flowering plants. These are in Row 6.
As patients, these are much more complex and developed people. They are concerned with the state of the world, their spiritual destiny, leadership, big ideas etc. Their pathologies are also deeper and more complex.
Row 5 contains the medicines/elements/herbs that will help the people who are interested in supporting the the kings of the world in Row 6. They are concerned with culture, artistic expression, invention… You are probably in Row 5. They are the Queens of the world. Row 6 are the Kings. Row 4 is concerned with work. They want to run the village. They are the solgiers and craftsmen.
I know this has nothing to do with the normal way of thinking about medicine but stay with me.
All of these rows have their ways of expressing pathology too. But the pathology is better described in the columns. Malaria is in Column 5. It is not just the disease that is defined as Malaria transmitted by mosquitos, it is those diseases that appear periodically. The fevers etc., come and go in cycles. As you go further to the right of table, the pathologies become more distructive. Syphilis is in Column 17.
The place that patients are in their life cycle also changes with the columns. The naive person who believes that only his own existence matters and all happens like an accident is in column 1. By Column 10, the patient is in full control of his life. He is full of confidence even to the extent that he is haughty. As an example, if you go down the rows in Column, you come to an Platinum. Platinum is an arrogant leader, isolated by his own pride.
As an example, I gave the remedy Platinum to a young man recently. I found Platinum through a complex method that I can’t explain here. I thought, this guy does not look like Platinum. He is beaten down by life and has IBS. He does not fit what I described above as column 10. Then, as he was getting ready to go and I was preparing the remedy for him, he described his history of adolescent suppression of extreme violent anger using psychiatric drugs. Then, the whole case came together in my mind. Indeed, Platinum is curing his IBS. Also, as a patient, he is getting much easier to deal with. He says things like “Thank you”. In his pure Platinum state, he never would thank me for the extra 9 yards that I would run for him. He was much to arrogant deep down inside. He would not show that arrogance to me in the first interview, but over the next few month communicating with him, the Platinum character came out. Now it is healing.
So, the idea is that these stages of life, pathology and ways of existing in the world as a psychological social being can all be described on the table of elements. Putting the plants on that table is a bit hard to grasp, for you and for me. But, I have actually confirmed my remedy selection using this table. If I got better at at this form of analysis, I would be able to even select remedies using this complexly described table. I would be able to find rare plant remedies and help patients who I have come to a dead end with.
That’s why actually identifying notes with column and row value is important. The plant content can go in a 3 level outline, but these plants still need to be identified by column and row. I am just learning this system so sometimes I will be asking what are the remedies that fall into x column. That will tell me more about what x column means. I will ask to collect column 5 remedies and learn more about the traits of malaria.
I think Tinderbox will do a better job of this than DEVONthink. Maybe I am wrong. Maybe I should use tags for rows and columns of the table of elements in DEVONthink, and give up on TBX. My fear is I will end up with a huge number of tags. DEVONthink is holding my notes, and TBX will index the information just for this project, not for everything I do. DEVONthink sorts through everything. That is too messy.
 . Rows could be “latitude” since I don’t know how to make up my own titles.
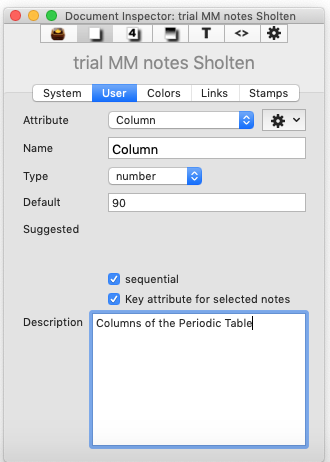 , then $Row that I previously set up in the same way disappears.