In version 8 Chart view does not appear to work correctly. When I expand an item it overlaps with the item below making the different fields illegible
Your post title says “Outline View” but you write about “Chart View”. Which view is the problem?
Could you post an image and/or sample file with the issue?
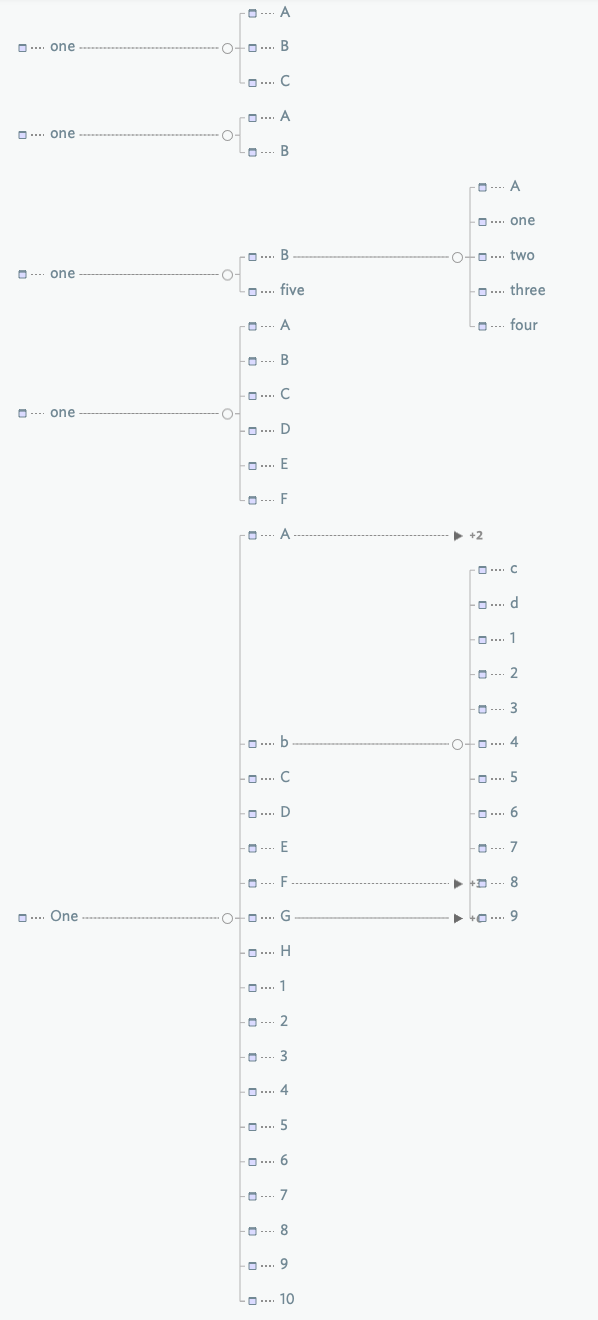
I am talking about chart view. The two figures below show chart views of the same document.
For example if I expand the outline on the left with +11 (mid way down) you can see that the +3 and +6 below have disappeared because they have been covered by the expanded 11 entries.

[admin] I’ve changed the thread title to reflect the subject
This isn’t a bug. Testing (using starter7.tbx as a common reference), when a branch is expanded, it flow across the end of other unexpanded containers. In doing so, it does hide the listing of the number of nested children of those containers.
But, if you expand those other containers, the view grows vertically so that the children of those containers don’t overlap.
Thus the view is architected to not be wasteful of vertical space - generally the smaller axis on any display. I do see the above behaviour could be better explained in more explicit fashion, as the above question indicates how the design intent of the view—with regard to expanded containers—is clearly not self-evident.
I opened the same document in the fig above in version 7 and indeed the chart view works well. I did not find any overlap even when some levels are not expanded. The problem starts with version 8. Version 7 expand downward in chart view and 8 from centre. I think if you test it in ver 8 you will find the problem.
Using the same file in v7.5.6 and v8.0.1 I see the same effect (as described in my last post). I’ll ask further.
1 Like
I have attached the file I was using as an example. The overlap occurs for me at entry x in chart view.
Example.tbx (106.1 KB)
Yes, I see it now. I’ve reported this on, the effect at ‘x’ isn’t intentional!
1 Like