I will be the first follower of this joyful trend! ![]()
1 Like
As a keyboardist who is very excited about Ziplinking, I completely agree. The benefits of hyperbolic are insight, ziplinking is ease of use. I’ll take the former any day, as I imagine would most TB users if pressed to pick.
I’d be interested in some feedback on your analyses in Obsidian. With zip links it is easier than ever to interlink notes within TB leading to a large network of notes and links. At the single or multiple note level I find that links provide quick and useful insight on how one idea is connected to another especially if we can now view the links at the bottom of the Text section. At the level of a full and busy notebook making sense out of the jumble of notes/links is much more challenging… hence my question on your experience in pursing QDA.
I take my cue in this area with ideas such as the ones outlined here. Some of the ideas mentioned in this post are:
- aggregate your notes into larger (perhaps temporary) groups. In TB this could be containers or an agent with specific queries. Aggregating a note level is something that does not yet exist if I’m correct (e.g. marking three notes and telling TB to make one note of the lot with some rules on how attributes are combined)
- simplifying the data model displayed. In TB this could mean filtering notes/links using certain criteria before displaying the resulting interlinked view.
- nested groupings which allow you as the user to choose the level of detail displayed (a form of visual grouping at different levels).
- filtering based on other criteria e.g. show only notes N links way as stuff that is much further out is likely only to confuse me. This functionality was raised already in other posts and I consider it very useful for these types of applications. By focusing on the note of interest and the more immediate connected notes the Hyperbolic view is already providing this type of functionality in a continuous sort of way.
- helper functions such as clustering and social centrality graph measures where the computer/algorithms help outline some basic structures in your file. I’m hoping some of these can be developed for TB to help answer these types of questions (which I’m also keen to explore with TB).
I’m a big fan of zip links which opens up interconnecting notes quickly and efficiently (e.g. creating the raw material for views such as the hyperbolic view). With zip links now well established it’s worth looking in more detail how best to make use of these links in extracting information from our cherished TB documents as you are doing.
Apologies to the OP, feel free to move this somewhere else.
Right now, my analysis is looking like exploring the graph in Obsidian, identifying clusters that seem interesting, verifying those clusters through queries in the Attribute Browser to make sure I’m interpreting the observation accurately, taking a screenshot of that analysis, and annotating it on my iPad. Here’s an example of one such annotation:
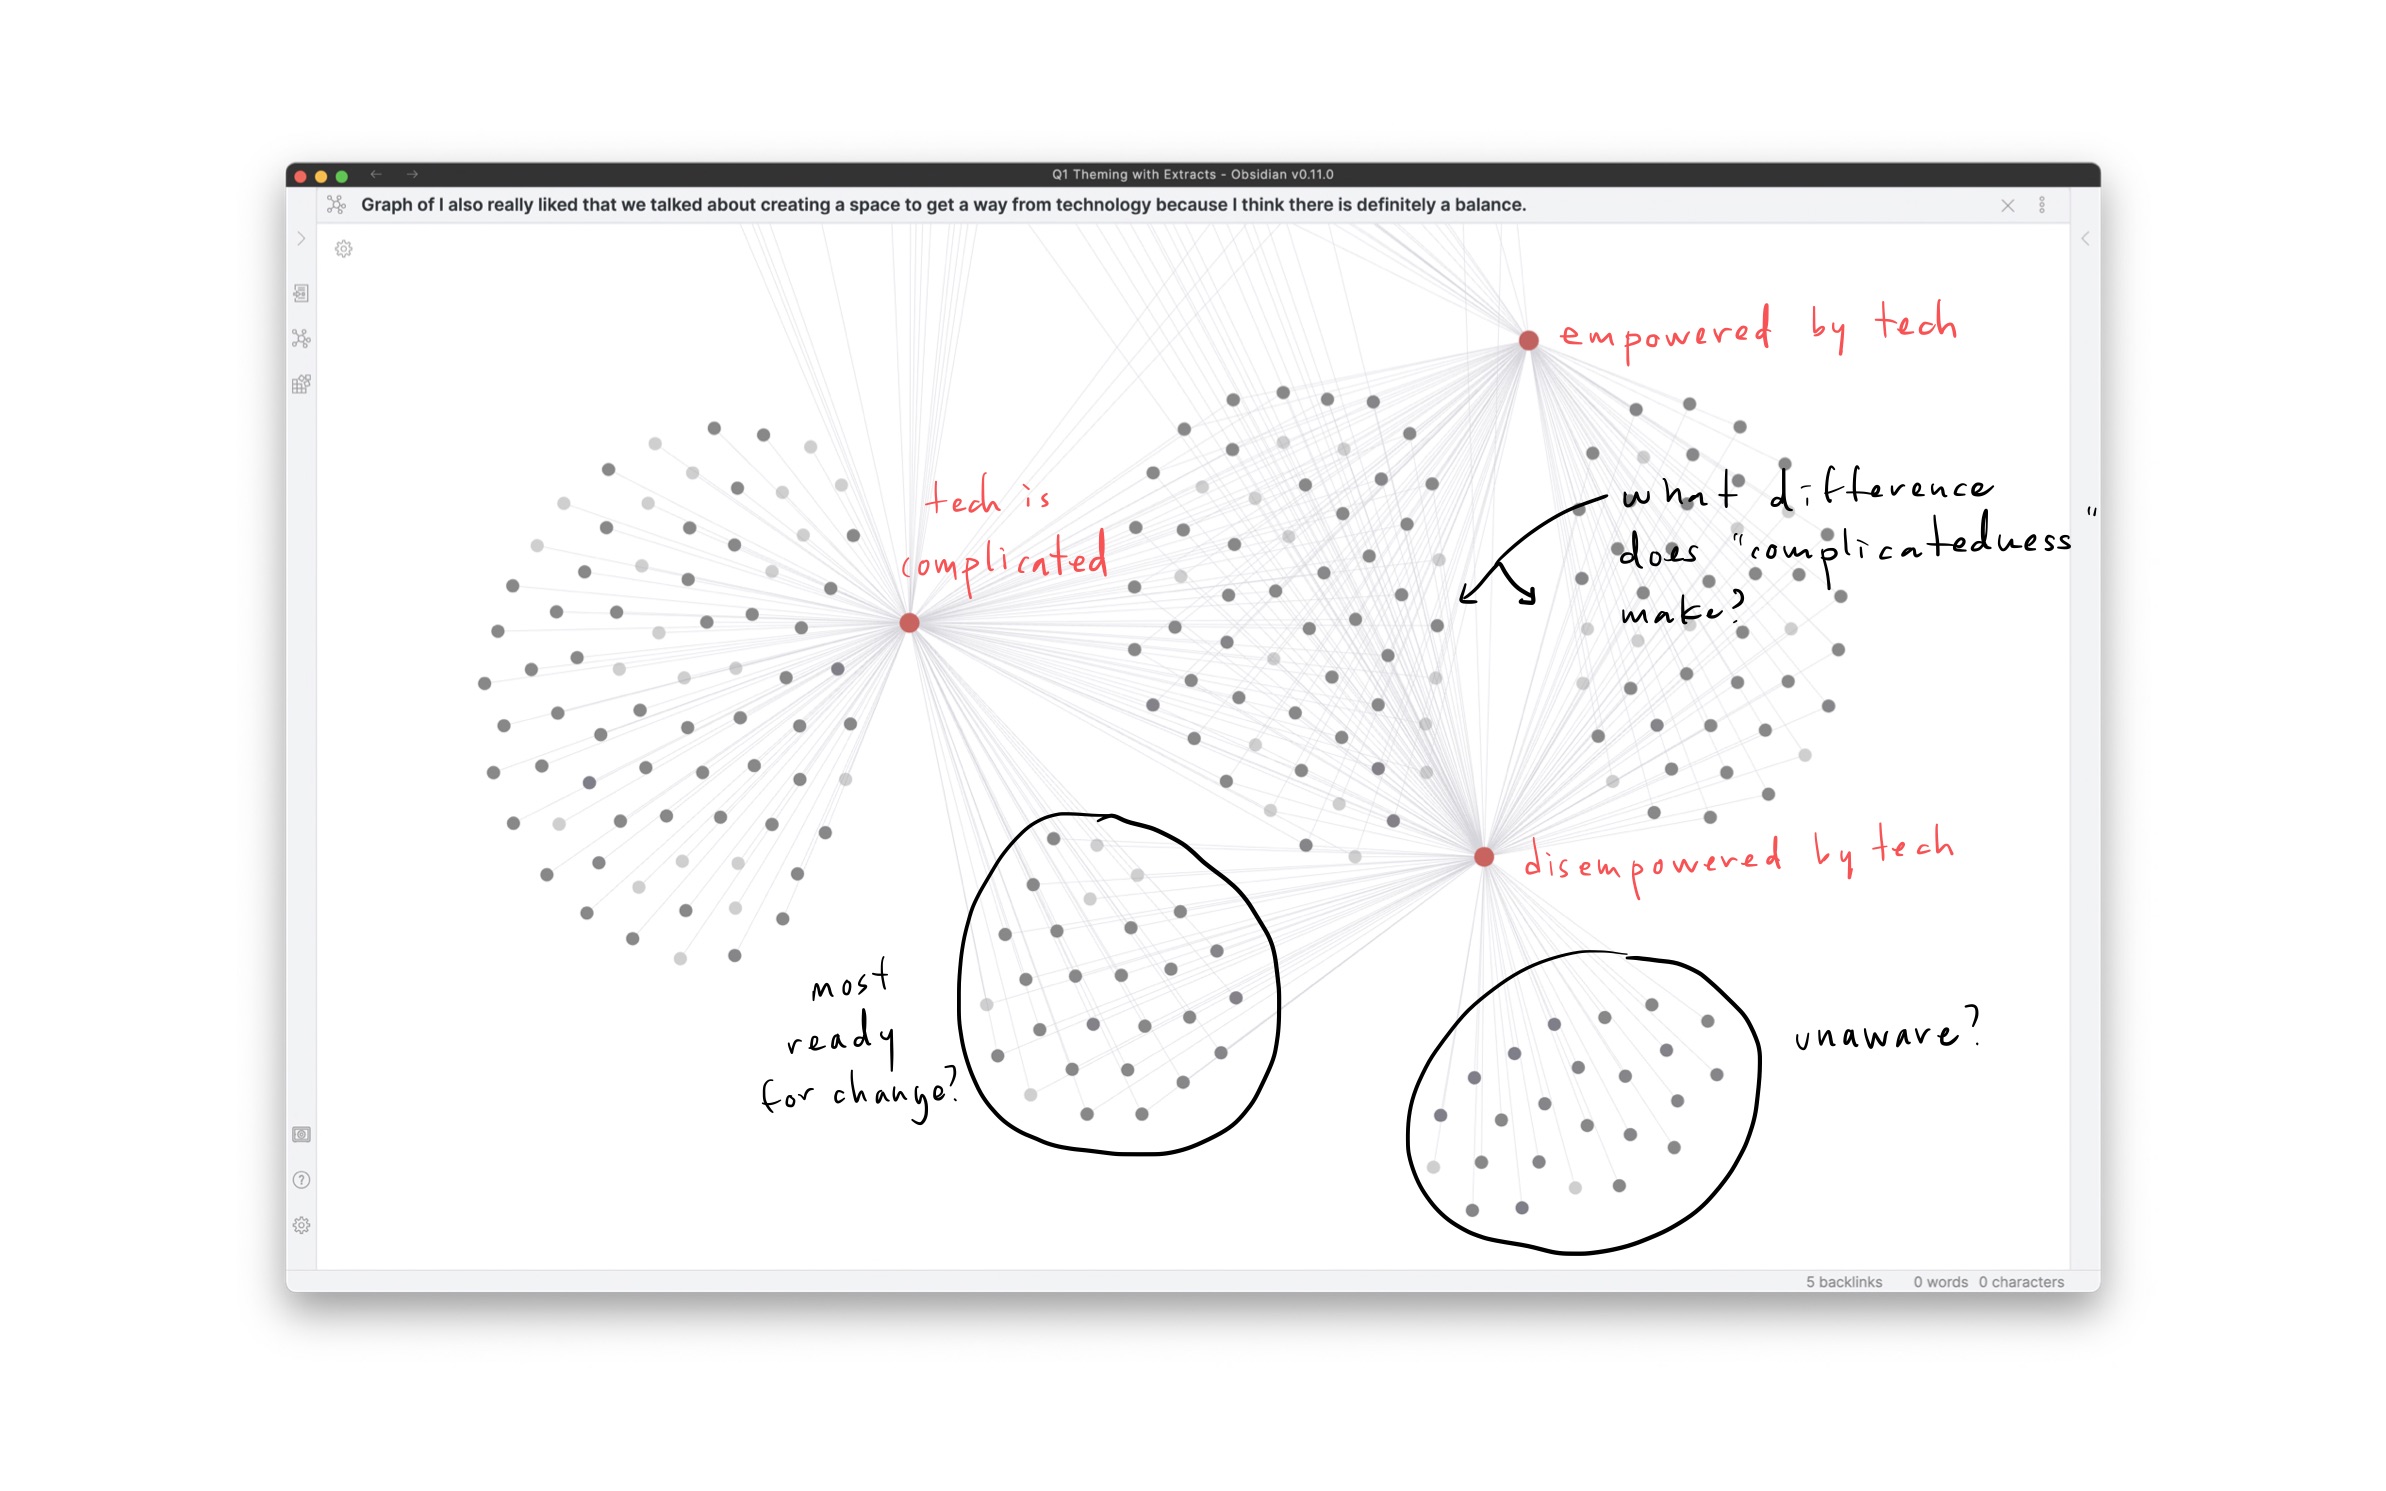
(One huge weakness of Obsidian is that I have to navigate the graph to get to views, I can’t “set” them. I also can’t interact with several data items at once. This creates scenarios where I feel I’ll lose my place or never find any given view again.)
As insights gain traction, I plan to recreate views in TB with agents so that I can add those analyses to the data source itself.
1 Like
Fascinating - thanks for sharing your approach and how you use both TB and Obsidian. It looks to me like you’re following a visual clustering based approach, annotating the clusters (on-screen) and then replicating the basics of the cluster within TB (or at least exploring further there).
Yup, much more succinctly put!
The problem limitation I see being noted here re force directed graphs is they only get you so far. You definitely get something, which IME is more often fresh questions than deeper insights. This is because the links, without any other metadata (on notes or links) don’t tell the whole story. I’ve had more success pushing tabulr note and link listings out to text and using Gephi (open-source, free to use)†. There are other similar tools but none seem attuned to the generalised, exploratory, sense-making we tend to do in Tinderbox and tend to be situated in domains like genome work or social media analysis.
However, such tools are slightly easier than web-vis libraries like D3 (plus many others) that can make fantastic visualisations—even interactive—of you can code the viz from the ground up.
Does Obsidian support link types? If it does/did, that ought to enable getting more out of force-directed graph. Filters, or working with abstracted sets of notes can help.
† I feel duty bound to note that if you find Tinderbox hard to master, you may not like Gephi. ![]() This
This
2 Likes
@mwra No, not at all — an option would be fine.
I realize that my use cases and interests are orthogonal to most here, and I would not want to have my needs satisfied at the expense of foisted them on the typical user.