Oh dear ! I have have perhaps made things more complicated that they should. I think some of the ideas can be implemented by building on the toolbox already provided by TB. Let me try an illustrate this with a somewhat different take.
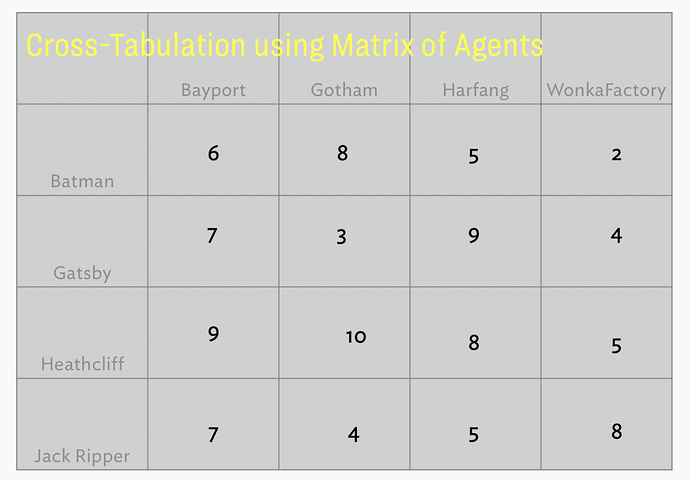
We focus first on the cross-tabulation function as a new tool (or dimension) within TB to summarise the contents of notes. A promising approach based on an enhanced AB was presented by PaulWalters. A second Map-view approach I thought of over this weekend is illustrated below. It’s based on the same dataset I mention above (using synthetic data) although this time I simply include a count of the notes in each class.
It’s based on a matrix of Agents, one within each of the table cells. It tells us for instance that there are 6 notes which have the $Name of “Batman” and attribute location “Bayport”, 8 notes with “Batman” in Gotham (which is by all accounts where Batman usually does his work in real movies and cartoons), 5 notes with “Batman” in Harfang etc…A similar summary is provided for the other 3 characters (encoded in the note $Name).
I generated this through a matrix of Agents. The upper left cell (“Batman” in “Bayport”) for instance has the query inside(/Notes) & $Name=="Batman" & $Location=="Bayport", the 2nd cell to its right inside(/Notes) & $Name=="Batman" & $Location=="Gotham" and so on throughout the table. I simply set the $DisplayExpression to the count of the Agent matches and could easily add more sophisticated queries and summaries.
If this process could be formalised in TB so that the table and queries for the cells are generated automatically you would have in essence Cross-Tabulation.
Regarding examples from applications, cross-tabulation is for instance a standard tool for analysing the results of surveys. Generally, survey results are presented in aggregate – meaning, you only see a summary of the results, one question at a time (e.g. in the TB world either via the AB view or using Agents for each question). Cross tabulation takes this one step further and enables you to see how one or more notes correlate to each other. This type of analysis can reveal a relationship in your data that is not initially apparent.
There is a nice example from the following website which can serve as an example and inspiration for TB: https://www.surveyking.com/help/cross-tabulation-analysis.
As a 2nd point I come to the discussion on Smart Adornments. This goes further than cross-tabulation and needs to be thought through carefully. I agree that collecting more than a hand-full of notes on overlapping regions will be very difficult to accommodate in a sensible way. I’m wondering whether adding queries to Containers (they are currently note used) might provide a venue to think about ?
