A new opportunity for cross-tabulations within Tinderbox

I miss the ability to cross-tabulate notes within TB. Inspired by the recent video on planning as well as a previous discussion cross-tabulation I would like to link the two issues and propose some ideas for enhancing future versions of TB.

The video demonstrates how the attributes of notes can be modified depending on their placement within a tabular arrangement of Adornments in a column and row formation e.g. moving a note from one column to the next will change the row attribute of the note. However, the inverse approach does not work. I cannot use Smart Adornments to automatically place notes matching the overlapping areas of the adornments.

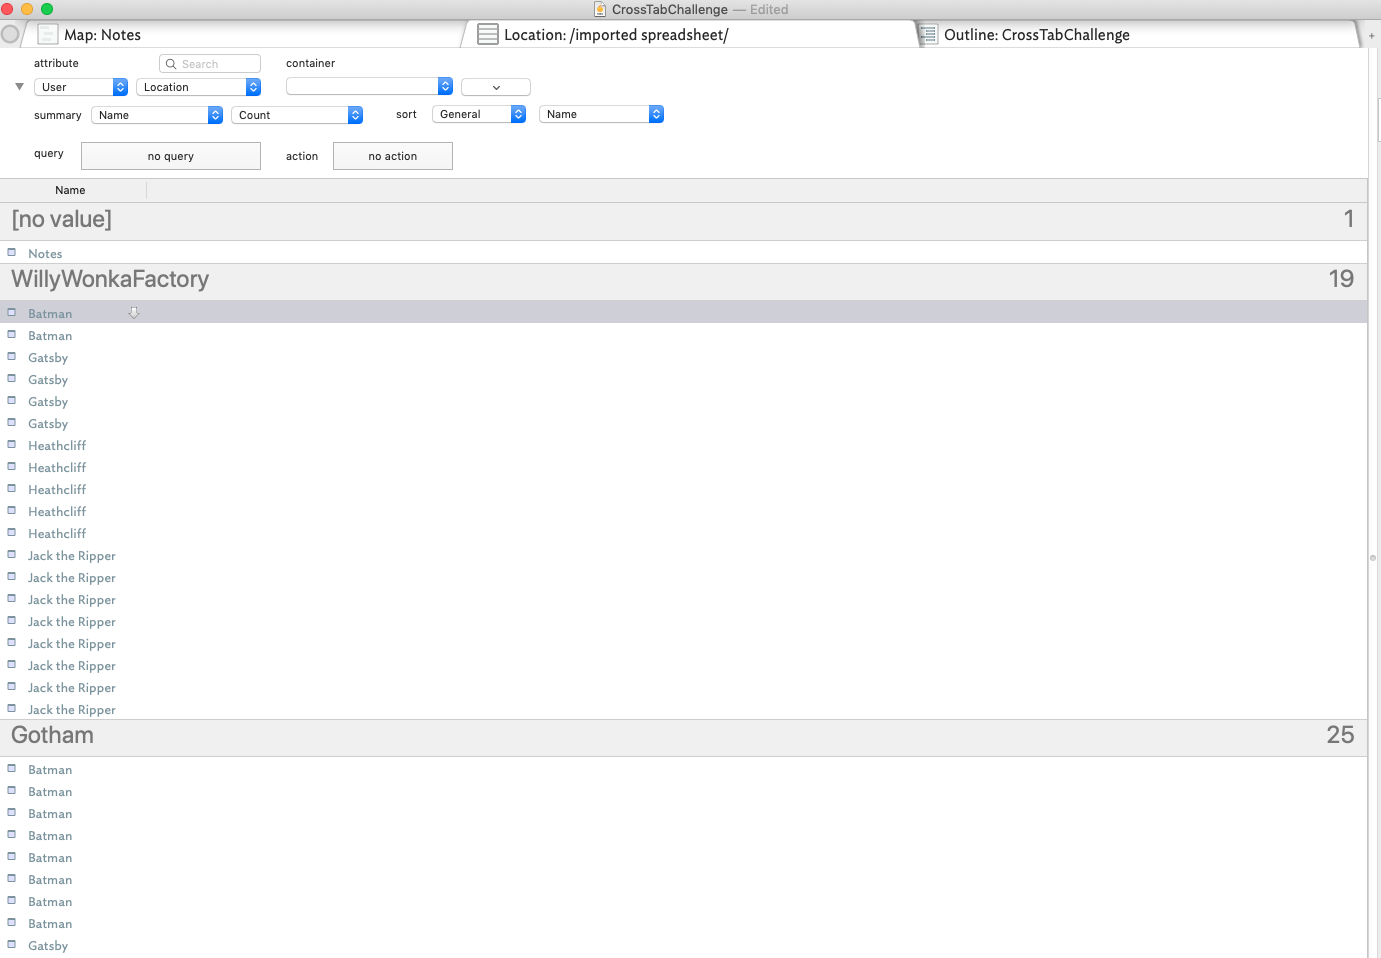
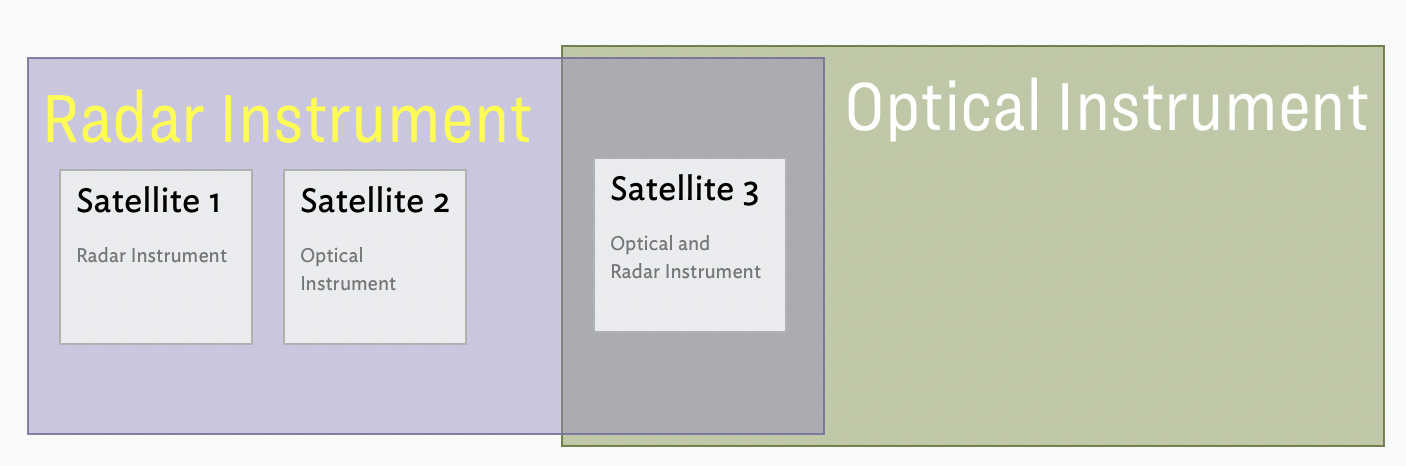
I provide an example below. The column Adornments are Smart Adornments with a query (for Column 1) : $Column==1 , and similarly for row Adornments (for Row 1): $Row==1.For each note I set the Key Attributes to $Column and $Row and set the values to the ones displayed in the note titles.
image
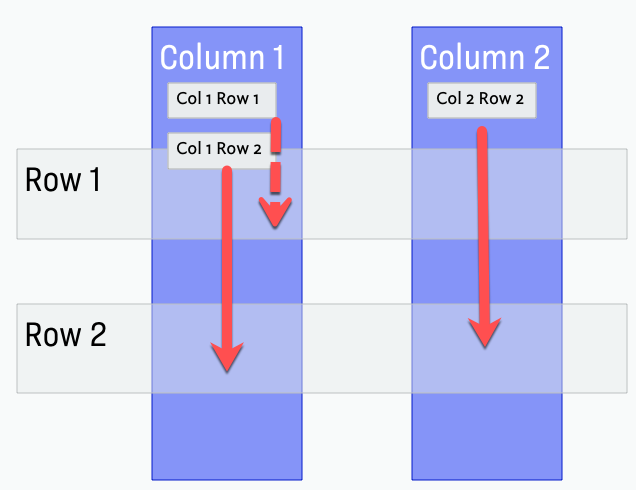
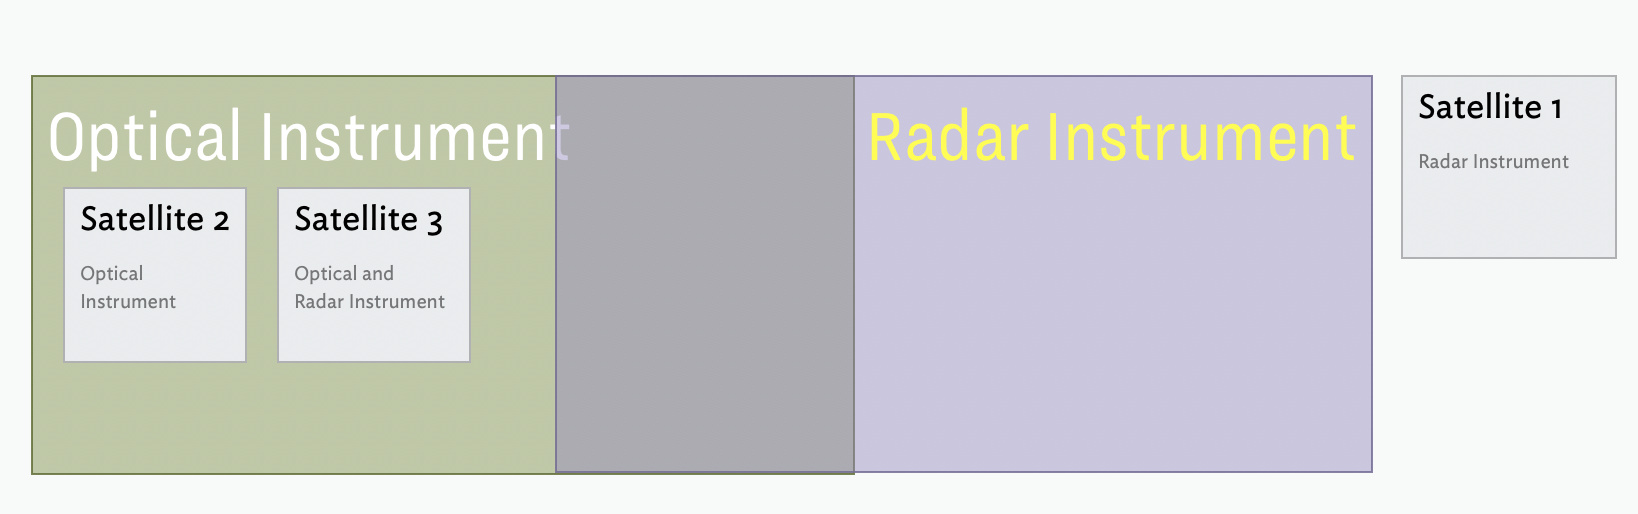
You can see in the example that this does not work. The arrows indicate where the notes should be placed to match both queries. I assume this is because Adornments are treated programmatically as single entities and are not “aware” of their areas of overlap. I’ve experimented a bit and depending on the size and shape of the adornments the notes are either static in the wrong positions (as for this example) or in other cases the notes will jump between the row and column matching positions.

Adding the ability to correctly match and place notes in such a fashion would be a step forward for TB in providing cross-tabulation functionality which is so far missing . In the TB context cross-tabulations could be implemented by collecting notes that matches two separate queries (one for each adornment in this case) and computing a summary of the result which could typically be:

  • The notes themselves e.g. paths or on the map simply a stack of notes
  • A summary metric such as total matches, mathematical sum of a particular numerical attribute, most frequent word used etc…

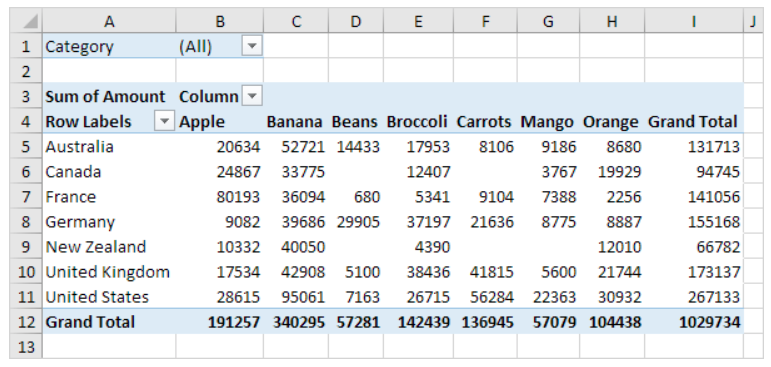
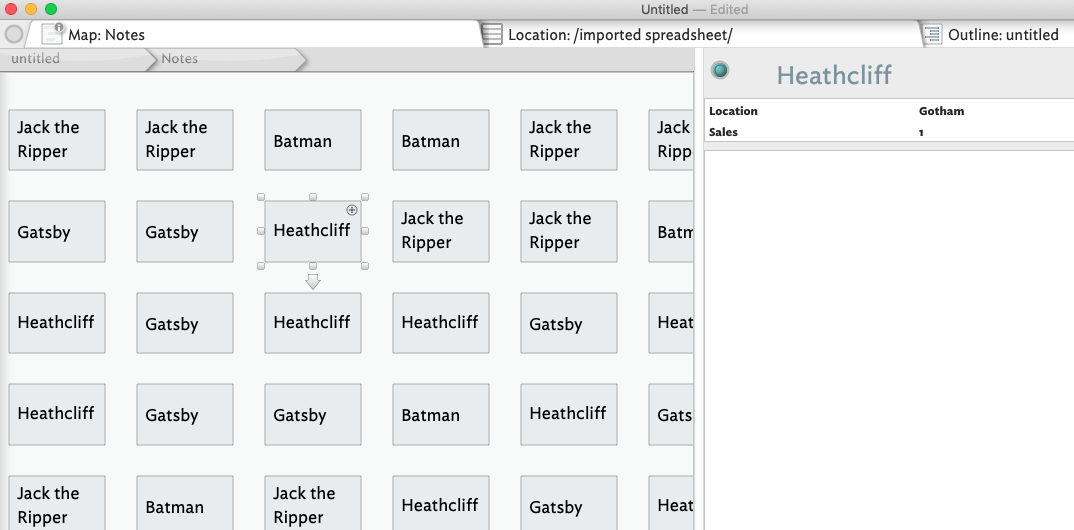
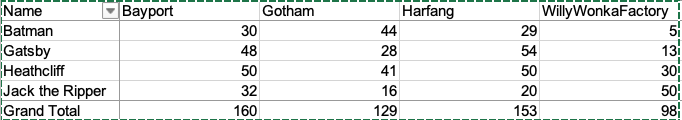
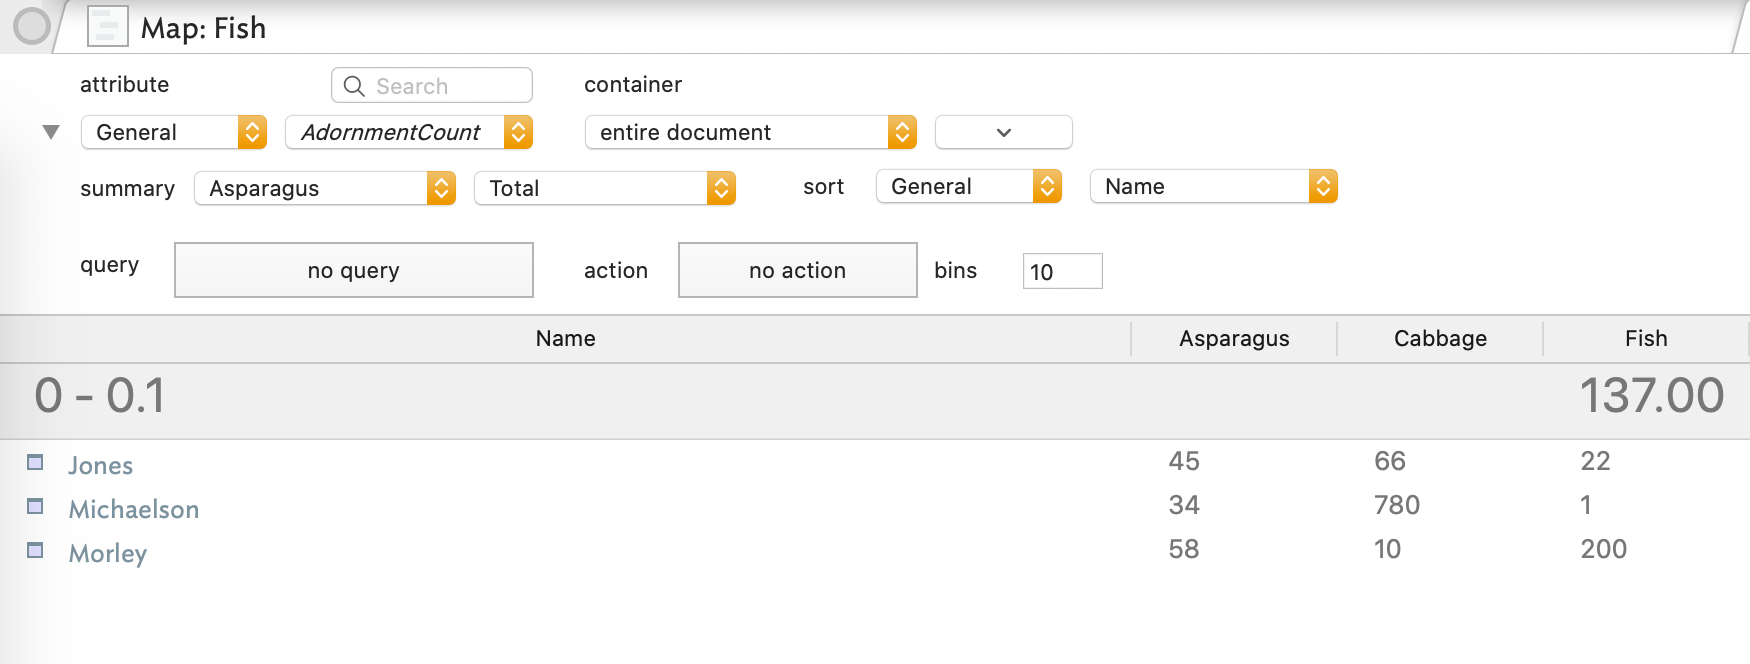
Having a list of notes matching two different attribute criteria would already be a step forward. To try an illustrate potential uses (for the writers among you) having for instance a list of characters as rows and chapters or sections in columns would help identify which notes involving a particular character appear where and when in the story as it develops. For the numerical summaries this is similar to the functionality provided by spreadsheet programmes such as MS Excel which refer to them as 2D pivot tables. Below an illustration of the sum total of the cost for each fruit as a function of country taken from a web tutorial.

Since agents can use the inside() function a similar functionality could be built up with the Map View by first defining smart adornments in rows and columns, defining their queries and collecting all notes matching the queries. Agents could then process the result with the help of a revamped inside().

New functionality also means new challenges to solve. From my perspective some wrinkles to address include:

  • The limited overlap space at the intersection between two smart adornments which limits the number of notes to be displayed. One way to address this would be to automatically move multiple matches into a container of matching notes.

  • How to display a summary metric. Perhaps the new containers generated can provide a dashboard style display ?

Ultimately - as an idea - it might make sense to revisit the grid feature of adornments and make them smart e.g. associated with a query, able to process matching notes and display a user defined summary.

1 Like

Interesting concept that might prove massively complex to implement. Not meant to be dismissive, but I wonder how many users need Tinderbox to be Excel?

A slide aside, but Attribute Browser view is an overlooked gem when analysing data and supports columns, actions and mote. (Mention of adornments suggests a Map view perspective). I suspect some of the above may be helped but using AB view.

I can’t comment on the complexity of implementation within TB. What I can say however is that

  • Conceptually cross-tabulation is not complex in terms of a method e.g. iterate through all values of an attribute1 and for each of these iterate through all values of attribute2 and record matching notes
  • Many of the building blocks for summarising are already part the current TB software (consider all the functions operating on lists such as min, max, sum, avg as well as various ways of extracting information for strings)
  • A basic functionality for cross-tabulation in Map view is illustrated in the video except that the notes have to be dragged by hand into place.

I include Excel only as an example of cross-tabulation in practice. I see cross-tabulation as a generally accepted method to summarise and provide an overview of a large number of notes in a structured way. The fact that there is a longish thread in this forum on the subject and an illustration of placing notes in a tabular way in the video are some indication this functionality might be welcome.

2 Likes

I don’t have a clear idea of what this would be like to implement. I did want to second @mwra’s mention that the Attribute Browser is an enormously powerful tool. You can find an intro to it, and some examples of its use, in this thread and related links, from a few years ago.

The most complicated cross-linking I do is with words, text, tags, etc, more than with numerical data. But some of the same Attrib Br tools that work with text would have numerical applications as well. In case you hadn’t looked at it carefully, worth exploring.

1 Like

Additional examples — especially examples (which I do not doubt can be found!) where Tinderbox is a better tool than a spreadsheet — would be welcome.

It might help to discern between two different aspects in the cross-tabulation discussion.

The first concerns the Map view only. What I’m suggesting at the beginning of my post is an extension of the functionality that was demonstrated in the video. In the video the Adornments arranged in a table structure with columns representing the venue and rows the time slots. The corresponding attributes of the note are modified and recorded as the notes are dragged in and out of the area of where the columns and rows intersect. In addition Smart Adornments have the ability to move notes within the current view matching their query onto the adornment. However this does not work for the case where two Smart Adornments overlap. To be consistent - if there is an area of overlap - notes matching the queries of both Smart Adornments should move to the area of overlap as this is the only place where both queries are satisfied (hence the red arrows in my diagram). From my perspective implementing this would already provide a rudimentary form of cross-tabulation if the Smart Adornments are arranged in a column-row format.

The second concerns a more general cross-tabulation functionality which may or may not be in Map view. I agree that the Attribute Browser view is powerful and can help summarise/explore the content of many notes. It could be my own shortcomings in the use of the mode but I cannot replicate the cross-tabulate functionality. I would be happy to be proven wrong on this point so I’ve generated a synthetic (fictitious computer generated) set of notes in a TB file for this community to explore. The file includes 100 notes with the attributes $Name, $Location and $Sales defined for each note. The $Name for each note is randomly selected from the set “Heathcliff”, “Jack the Ripper”, “Batman”, “Gatsby”, the locations are selected from “WillyWonkaFactory”, “Gotham”, “Bayport”, “Harfang” and the $Sales is a random number between 1 and 10. I include a screenshot below to illustrate the file contents.

The challenge is the generate something along the lines of (forget the grand total line at the bottom)

image

within TB using for instance the Attribute Browser. I don’t get much further than the following which includes a summary of the count of the number of notes by location. I cannot get for instance a summary of count for location and name at the same time.

Here the link to the TB file: Dropbox - CrossTabChallenge.tbx - Simplify your life

Here the link to the original TB file used to illustrate the first example in Map view only.

I think if Attribute Browser could have more than one summary (i.e., summarize each column in a section) then it would get close to the proposal. Then if AB had the ability to add a special column for row totals of the selected attributes, it would be almost all the way there.

In this example we can only summarize on $Asparagus (a numeric attribute). I’m suggesting options to have summaries for most or all of the attributes in the columns.

Fish.tbx (117.2 KB)

Thanks for all the feedback so far. I agree with Paul that a modified AB mode which includes a summary for all columns in each section would get us very close. If in addition there was a way to blend out all the notes in each section (ie. display only the summary) and the user could select the summary function you would have pretty much all the functionality. This could be a way forward for non-Map view.

For the Map view I realised that my suggestion goes deeper that cross-tabulation. What I’m suggesting is even Smarter Adornments that interact and are aware of their intersections/overlap within the Map itself. Here an illustrative example that has nothing to do with columns and rows, and lies closer to my area of work within the European Space Agency (ESA).

One way of classifying earth observation satellites is in terms of the instruments they carry and image our planet. A convenient distinction is between optical instruments operating in the visible and infra-red and radar instruments operating at microwave wavelengths. Suppose I have a series of notes describing current satellites (NASA, ESA, China etc…) and in each of these notes I specify which type of instruments are on-board using a boolean. The key attributes will look something like this for a satellite with only a radar instrument on-board

image

Suppose I create an adornment to gather all radar satellites in a Map. I set the query to $Radar==true and presto, all satellite notes with a radar instrument on-board are moved to my adornment.

I then do something similar for satellites with optical instruments setting my query to $Optical==true.

Now suppose I have a satellite with both optical and radar instruments on-board. I’m obliged to set $Radar==true and $Optical==true. Ideally I create a zone of overlap between both adornments in which both conditions should apply (the area after all is covered by both adornments). However TB is not set up yet for this and the results are undetermined or just plain wrong. Here an example of what I get

In the solution I’m looking for Satellite 2 should appear in the green area of the optical adornment, Satellite 3 in the area of overlap and Satellite 1 stays where it is. Depending on the arrangement of the Adornments I get other results such as this:

Here Satellite 3 should lie in the area of overlap and Satellite 1 lies completely outside for some reason.

The behaviour I’m looking for in TB Map view is linked to Set Theory and consistent with the intersection of two sets. It’s also generally useful in many other areas (think for instance of identifying scenes in a novel summarised in TB notes using Adornments with character A, with character B and those with Character A and B e.g. area of overlap).

I’d be interested in hearing more ideas and opinions on the above in your user context.

Not true, just use a set $InstrumentType and set values accordingly. I’ve been up this blind alley before and tend to start with sets and later add booleans for data strands I pick out later.

I note this as if the extra engineering for this is meeting the cross-cut of two Booleans, there is a solutions. also how does this scale, say for 4 overlapping smart adornments.

Tinderbox is a toolbox and forgiving of false starts in incremental formalisation, e.g. using Booleans where other data types would better serve the task. Again—from experience—the answer is often in using more than one view type and leveraging user attributes.

Thanks for the tip. I understand the use of Sets can be more elegant in this context and less prone to errors.

Unfortunately it does not affect either the results or the nature of my request. If I create the attribute $InstrumentType as you’ve suggested and modify my queries to $InstrumentType.contains("Optical") for one adornment and $InstrumentType.contains("Radar") for the other I still get exactly the same results as above.

Fundamentally I’m proposing that we treat overlapping zones of adornments as the intersection between the two. This is consistent with the use of TB in other few examples I’ve seen, to whit:

  • the recent video from Mark Bernstein on planning with Tinderbox in which the areas of overlap are used to set attributes in the planning notes. This itself was based on another post on the subject
  • the manual positioning of notes across different Adornments to indicate that it belongs or could belong to different categories (e.g. in the TB Book and others)

Or simply make an adornment with $InstrumentType.contains("Optical") | $InstrumentType.contains("Radar"). I say this because I whilst I get the intent, I’ve a sense this scales badly, The issue isn’t what I as a user intend/imagine while happen when I actually use the tool (and as so often, not quite as I imagined I did).

Re the Tinderbox video, I assume you refer to c.7:35 and the adornment grid. The reason $Venue and $Slot values change is due to the adornment’s OnAdd action. A note moved on top on N overlapping adornments will receive the OnAdd of all of those atop which it sit (or partially sits). What follows isn’t an argument for/against, but simply an attempt to explain the status quo (as at v8.2.2).

Uniquely to map view an item is inside an adornment atop which it sits. Consider this map:

and this agent query:

inside("AAA") & inside("BBB") & inside("CCC")

…which, for the above map, matches ‘note 2’.

So, why not the same with smart adornments? As it is, a note can only match one smart adornment; I’m not sure if it is the uppermost (if overlapping). Any note matching the smart adornment’s query is moved atop that adornment. Any note not matching the adornment query is moved off that adornment onto (an unadorned) part of the map, ideally so as not to overlap another note.

Note that an accidental overlap might otherwise trigger an OnAdd action, or a nesting or composite effect. Queries and actions (rules, etc.) fire in outline (i.e. $OutlineOrder) sequence. Thus, whilst on a heavily taxed map you might see a note meeting several smart adornment’s queries bounce around the map, it’s more likely you see the outcome of the end of the agent cycle - i.e. the notes are arranged as per the last query evaluated.

The outcome is that at present a note can’t be placed automatically atop more than one smart adornment. also, given the above, re-tooling to ‘just’ make such an outcome possible is probably a little more complex than presumed, as the map would have to detect all overlaps, generate the merged queries etc. and factor that into the agent cycle.

All of which is not to say the asked for behaviour may/can not happen, that’s up to the developer. I’m just explaining why it may not be a simple/quick request to meet. :slight_smile:

1 Like

We seem to be converging in our understanding and I was indeed referring to the section of the video you mentioned (e.g. changes in $Venue and $Slot depending on the location of the note above intersecting Adornments).

It is already the case that the user either needs to choose to use the OnAdd action(so as to manually and freely move the note around within the map a registering the result of the OnAdd) or work with Adornment queries (which instead automatically move notes matching the query to the Adornment location). So I don’t see a conflict there.

Since TB is not (yet) programmed to handle overlapping Adornments with queries the outcome is along the lines you describe. I’ve experimented a bit and I either see the notes picking a given Adornment where one of the queries matches or jump around between Adornments just as you’ve described.

I cannot judge in detail complexity of accommodating multiple overlapping Adornments with queries. Conceptually it should be reasonable for the following reasons:

  • Tinderbox adornments have a square or rectangular shape making the computation of intersecting areas relatively straightforward even for multiple overlaps.
  • You’ve already pointed out in your post some of the steps that would need to be taken. In areas of intersection TB will be essentially creating a new “virtual” Adornment for these areas, with queries built out of the two (or more) overlapping Adornments. In your case your new query was inside(“AAA”) & inside(“BBB”) & inside(“CCC”) built from the 3 overlapping Adornments and their original queries.

The advantages are the ones I described. In a Map with many notes the user can explore the intersection of criteria visually and quickly by defining the right Adornments and bringing them together in ways that allow for further interpretation and have meaning.

1 Like

My current thinking is that the discussion of cross tabs through overlapping smart adornments, or through smarter grid adornments, is probably a dead end. It could work, but it’s tricky: in particular (as people have foreseen), we’re going to have trouble coping when lots of notes (or very big notes) want to be in the same crosstab cell.

I think we need a new view to do this in a satisfying way — on that is in some ways like the map view, but that isn’t literally the map view. And it’s in some ways like the attribute browser, but it’s not the attribute browser either. That’s a fair amount of engineering, but it’s not our of the question.

So that’s where my current thinking is headed. I can be persuaded. I’d also greatly appreciate plausible example data, both for testing and marketing and because real data might suggest real tasks that ought to be supported.

2 Likes

Oh dear ! I have have perhaps made things more complicated that they should. I think some of the ideas can be implemented by building on the toolbox already provided by TB. Let me try an illustrate this with a somewhat different take.

We focus first on the cross-tabulation function as a new tool (or dimension) within TB to summarise the contents of notes. A promising approach based on an enhanced AB was presented by PaulWalters. A second Map-view approach I thought of over this weekend is illustrated below. It’s based on the same dataset I mention above (using synthetic data) although this time I simply include a count of the notes in each class.

It’s based on a matrix of Agents, one within each of the table cells. It tells us for instance that there are 6 notes which have the $Name of “Batman” and attribute location “Bayport”, 8 notes with “Batman” in Gotham (which is by all accounts where Batman usually does his work in real movies and cartoons), 5 notes with “Batman” in Harfang etc…A similar summary is provided for the other 3 characters (encoded in the note $Name).

I generated this through a matrix of Agents. The upper left cell (“Batman” in “Bayport”) for instance has the query inside(/Notes) & $Name=="Batman" & $Location=="Bayport", the 2nd cell to its right inside(/Notes) & $Name=="Batman" & $Location=="Gotham" and so on throughout the table. I simply set the $DisplayExpression to the count of the Agent matches and could easily add more sophisticated queries and summaries.

If this process could be formalised in TB so that the table and queries for the cells are generated automatically you would have in essence Cross-Tabulation.

Regarding examples from applications, cross-tabulation is for instance a standard tool for analysing the results of surveys. Generally, survey results are presented in aggregate – meaning, you only see a summary of the results, one question at a time (e.g. in the TB world either via the AB view or using Agents for each question). Cross tabulation takes this one step further and enables you to see how one or more notes correlate to each other. This type of analysis can reveal a relationship in your data that is not initially apparent.

There is a nice example from the following website which can serve as an example and inspiration for TB: https://www.surveyking.com/help/cross-tabulation-analysis.

As a 2nd point I come to the discussion on Smart Adornments. This goes further than cross-tabulation and needs to be thought through carefully. I agree that collecting more than a hand-full of notes on overlapping regions will be very difficult to accommodate in a sensible way. I’m wondering whether adding queries to Containers (they are currently note used) might provide a venue to think about ?

1 Like

This is interesting – thank you @mdavidson

It seems to me that container tables and table expressions, etc., can be used already to get part way to the goal. Not sure.

You are right: tables already exist in TB. In addition to container tables + table expressions, the Attribute Browser mode and Outline mode with columns enabled are essentially tables. Unless I’ve missed something a common characteristic of these views is that they provide a note by note view, with notes lined up as rows and attributes as columns. Only the AB mode provide some limited functionality to summarise based on groupings e.g. count for each group etc…

Let me propose some terminology to compare and contrast with the existing capabilities of TB and respond to @eastgate’s request on ideas for marketing the new capabilities: similar to Adornments I suggest we refer to the possible new functionality as Smart Tables ! After some brainstorming I think we can defined Smart Tables to have the following characteristics:

  • The meaning of each row and column is defined and can be referenced by the SmartTable. This contrasts with the current table drawing option in Adorments in which the rows and columns are visual guides only. The current Adornment itself has no concept of columns and rows, only the user as he/she positions the notes on-top of the table.

  • Includes options for automatic labelling of the rows and columns. The labelling of my example cross-tabulation above was done by hand by identifying the unique note names (e.g. the range of $Name) and the range in $Location. I then had to type in carefully (with many “;” spacers) the row and column names. Ideally this is done automatically by TB based on the selected attributes to explore within the SmartTable or based on typical use cases e.g. weekly or monthly calendar.

  • Retrieves the paths of the notes matching the conditions for each cell within the Smart Table and applies a user defined action code (or a default action such as note count which is what I used in my example using an 2D table of Agents). This is at the core of SmartTables. I think that most users would like access to the notes that have been matched to explore further the trends that appear in the SmartTables so it would make sense for each cell to act like an Agent with aliases to the original notes (in essence it would function like a 2D dashboard). On the other hand I also like the action of Adornments operating with queries which can quickly assemble random notes in Map view into structured thoughts. In this case the SmartTable would need to create new containers one level below the current Map view (like bins) in which to assemble the matched notes for each cell. This would be useful for instance for quick brainstorming as the user types in ideas and these are magically moved to the right location.

Thorny questions relating to implementation still remain. Should it be a new view or a special object in a Map view e.g. like composites ? Complexity ? I’m not sure. I hope that by outlining what a Smart Table might look like I make the link to the wishes of other users of TB and their use of this tool.

Have you seen adornment grids? Admittedly, I think they are intended for manual placement of notes, e.g. the grid squares aren’t ‘aware’ of a smart adornment’s query. But, it does seem there is some scaffolding already in place for a table-like adornment. However, given all the ideas outlined, I’m not sure I’d not prefer such cross-tab in a separate view type lest complicated adornment tables put even more load on busy maps.

The latter possible separation also touches on another aspect of such tabulation: its current separation from action code. For instance, AB view is great except there’s no way to access/export value pairs for headings and counts, nor can you hide category items so as to only see the category label. Manual transcribing is involves a lot of scrolling - especially when your 000s of notes in scope.

Thinking of @eastgate’s question about use cases, my recent PhD researches have involved a number of projects with an initial qualitative phase, exploring the data and surfacing structures and themes. this is then followed by a more quantitative phase of collating and tabulating the findings. The latter would have been much easier with a cross-tab method.

For my part, I’m less worried about map use than the ability to do more than put the cross-tab numbers on screen. In a large project, it is very likely these figures (counts and their associated query/category) need to be exported somehow. It might be as simply as placing the data on the clipboard in tab-delim form, or it might be making exportable to the rest of the doc via action code, or combining with export code to export the data as a file.

All that said, despite the above experience in my own work, I’ve not pushed for this aspect of the app. This is because I don’t see evidence that it is something used/wanted by a significant number of users and thus the ROI for a small developer. IOW, I’d probably use such a feature but those of use doing so might be an expensive minority to service. As it is I’d rather, for instance, see Hyperbolic view properly matured before this. Improving the hypertextual tools seems more core to Tinderbox as an app, too. In an ideal world we’d have both :grinning:

1 Like

Good to hear that you too would have benefited from cross-tab methods for your TB-based analyses. It means that there are at least two of us :slightly_smiling_face: Clearly users with only a limited number of notes, or, focusing on visual placement of notes cross-tab functions are overkill. However, I suspect that for users with say 100s if not 1000s of notes, cross-tabs would be a very useful as a tool for summaries, trend analyses, correlation etc…

I’m aware and use adornment grids. They are good visual guides to placing notes and interpretation…that as far as they go. I use them quite often.

I have no idea if I’m (or we) are in a minority. Cross-tabs are a wide-spread general technique to summarise information content and tables are already part of the TB idiomatic expressive possibilities. I’ll let others make that call. A minimalist solution to me with (hopefully) reasonable R & D investment would be to start with smarter tables in adornments building on my previous home-made hand-coded cross-tab example. This would involve

  • the table cells are aware of their row and column cells, and of the row and column headers
  • an easier and more automatic method for labelling the rows and columns by the user rather than the kludgy current method in which empty cells require a “;”
  • the row and column headers can be attributes
  • the cells can have an OnAdd action associated with them
  • agents, notes or containers can easily be aligned to fit within a given cell so as to yield a regular 2D array of notes
  • a method for generating automatically an array of agents