Aggregating notes in xyplots

I’m trying to create a plot of fixed bugs as part of an ad-hoc issue tracking system. Each issue is represented by a note, with three user attributes: $Critical, $Resolved, and $ResolveDate which are used to track pretty much what they seem like they would be used for. I want the plot to show the number of resolved issues by date, but it doesn’t seem that I can aggregate values. My initial attempts at using action code led me to use an xyplot with $ResolveDate as the X value and this as the Y value, but it doesn’t work:

count(collect_if(siblings, $ResolveDate==$ResolveDate(that), $Name))

Has anyone built a plot that aggregates values which they can share? Is the current plotting logic able to support this use case? Did I do something wrong in the action code?

This works for me. If the above code’s output is passed to a Number-type attribute, I get a count of siblings using the same $ResolveDate.

However, if run in all siblings, each will have the same number count. Or are you trying to get all notes with the same $ResolveDate to plot on top of each other and then have a the front-most (which now hides the other) show the count of co-located items.

It’s worth noting that Tinderbox maps aren’t designed primarily as graphing tools. You can make X,Y plots but don’t assume action code has one-click operators for this. In other words, do test your assumptions re graphing before trying to use them.

Yes, that’s close to what I’m trying to do and would probably suffice, though having overlapping items isn’t a requirement.

Fair; I’m trying to figure out if this is something that Tinderbox can do already or if it’s worth a feature request.

In an xyplot where the user provides an arbitrary expression for both axes, it’s reasonable to expect that some notes will be assigned to the same X value. If this happens, there needs to be a way of deciding what value to show for each X value based on its set of notes. (This doesn’t occur for other types of plots because the X values are guaranteed to be distinct.)

For my purposes the most natural combining/aggregation function would be a simple sum, but I can imagine wanting things like min, max, mean, variance, and so on. Writing those functions isn’t hard if you can do basic arithmetic operations. Unfortunately I don’t think the Tinderbox action language has a way for users to define functions or other types of variable closures (beyond this/that which are managed by the system), so this may wind up requiring another system attribute.

tl;dr - I think there should be another argument to xyplot which takes a reduction function of the type Set Number -> Number which is run for the notes at each X value in the plot. The default value would be the sum function.

I’m tied up at a conference (Intl Conf. on Intl. Digital Storytelling) this week. But this looks like an intriguing idea; perhaps you could elaborate it a bit for a week — making it no harder than at present to make simpler notes, and also giving some thought to the Plot Inspector — and then send it along after Dec 10?

I’ll see what I can do; I’m also going to be traveling for work at the end of the week so no guarantees.

I’d agree with @eastgate that there are some interesting ideas here. Meanwhile, I’d like to unpick some (intuited?) assumptions…

A Map allows more than one note to be put at the same {X,Y} location. Here…

Untitled%202018-12-02%2021-14-52

…there are actually 3 notes (‘AA’, ‘BB’ and ‘CC’). A long-term user of Tinderbox might spot the stack via the additive effect of 3 drop shadows.

But, we only see one note. It’s an equally fair assumption that Tinderbox might be help ful an re-arrange the notes from their specified location in a manner that makes all visible:

Untitled%202018-12-02%2021-19-16

Plus, in this scenario do we composite the colocated notes or not?

In other words, I think its fallacious to assume the behaviour based solely on our desired task (summing values) as this ignores the fact that Tinderbox is a toolbox with different sub-sets of users employing notes in different ways. Thus, the ‘default’ behaviour warrants careful thought (is is reasonable for most users or only some). Whatever, the default and design intent behind it need capture (which I’ve attempted in aTbRef) as each new user tends to arrive with their own intuited idea of default behaviour.

Actually the task reinforces an existing feature request, for an action code operator to return an array of counts of discrete value counts for a given attribute. the Attribute Browser views allows you to do this in the UI, but such counts are of little use except as read ‘manually’ (by eye) from the screen. They can’t be exported or further manipulated within Tinderbox. This is a shame as such counts are a valuable emergent property of qualitative work that Tinderbox general supports well. It’s just frustrating that the end data in AB view is off limits for further use.

We’re talking about different things here, so let me clarify: I’m not talking about map XY values, but rather plot XY values. In a Tinderbox xyplot, each of the notes contributes a single (x,y) pair to the plot.

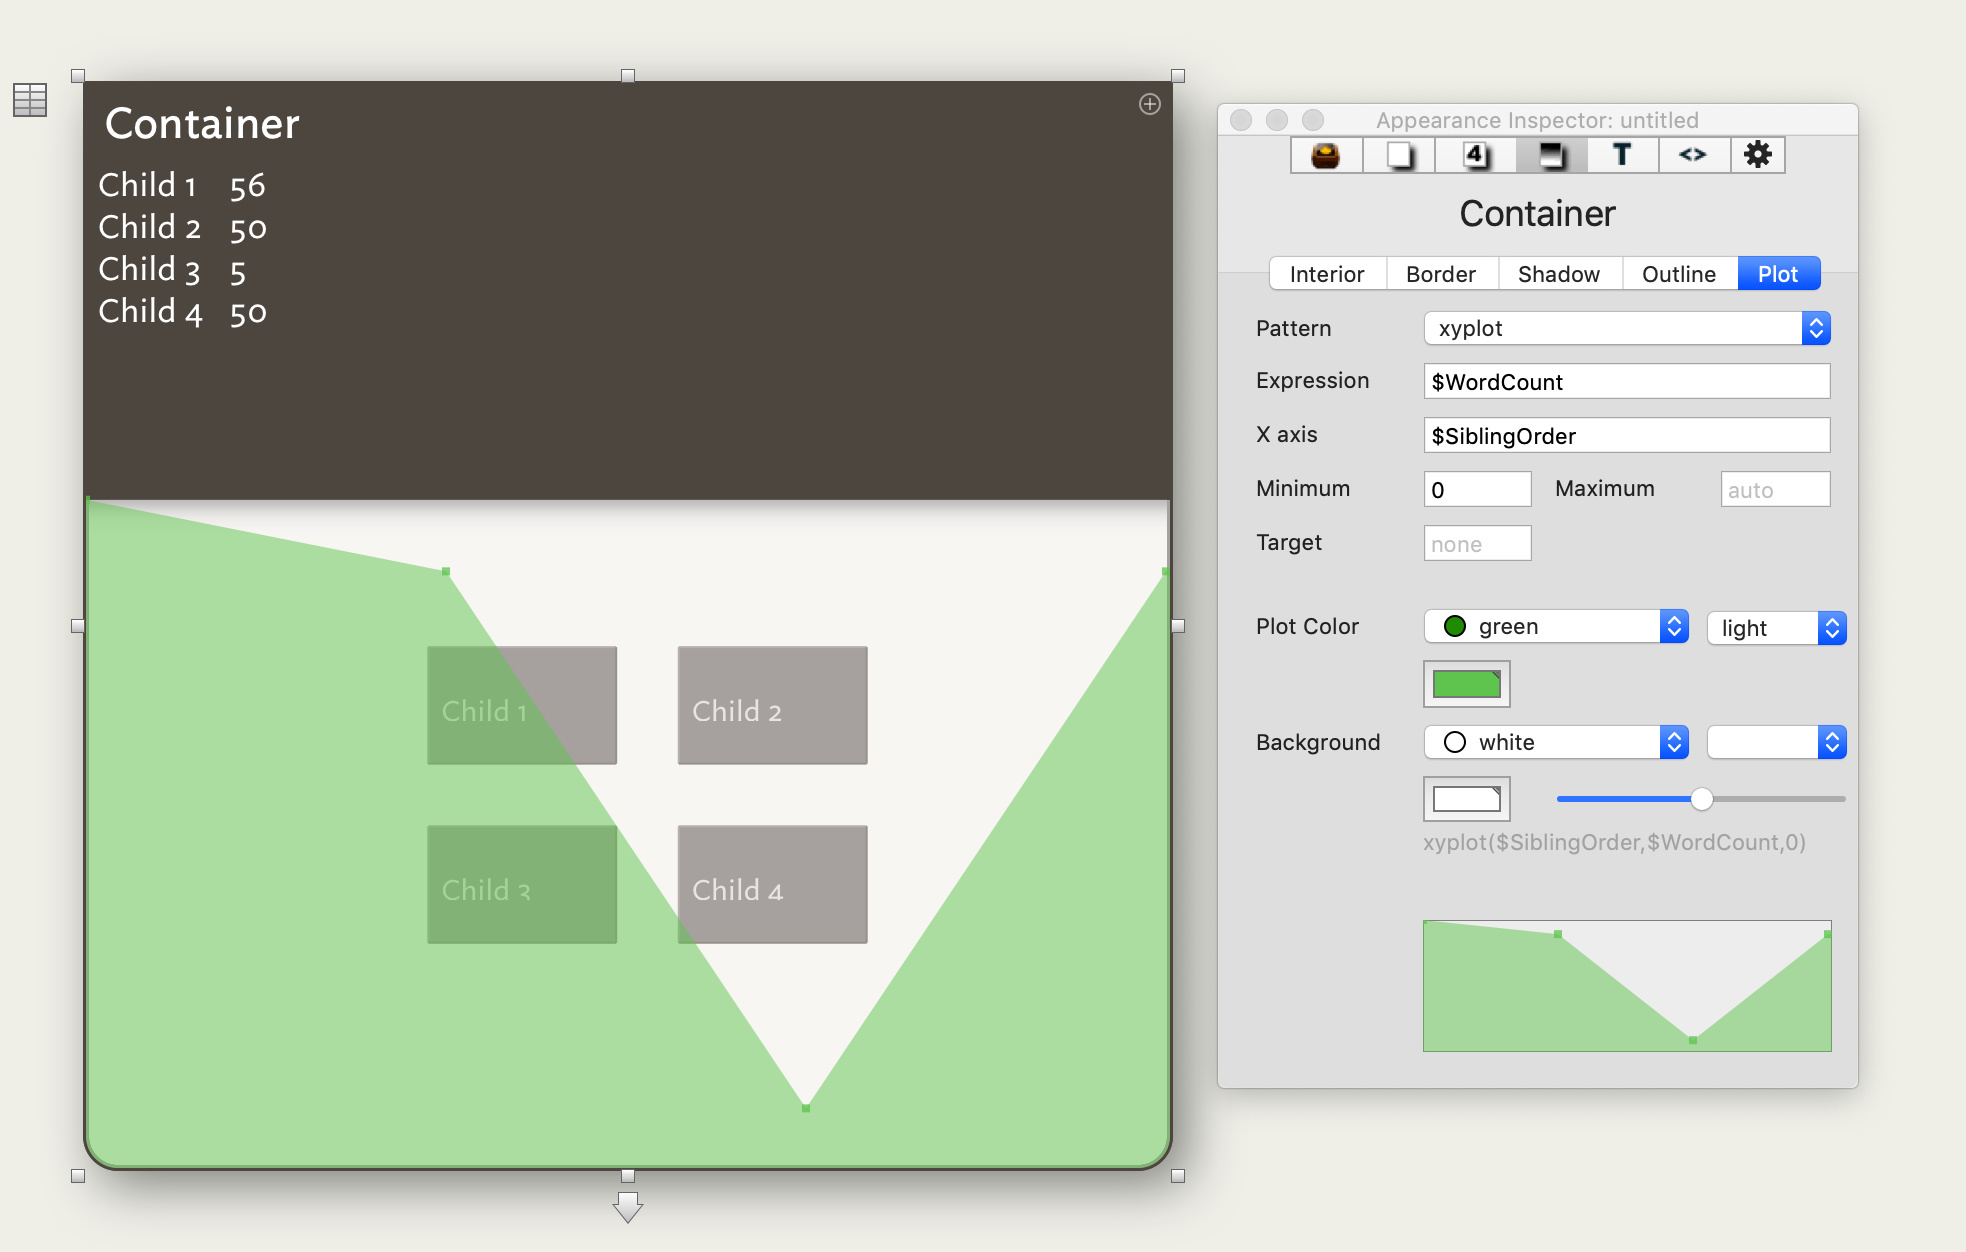
For example, here I have a container with 4 children. The y value for each child is its $WordCount, and the x value is $SiblingOrder. Here there is no aggregation required, because each note within a set has a unique value for $SiblingOrder. Note that this setup matches the behavior of the vanilla plot and bargraph commands, which also use $SiblingOrder for their x values.

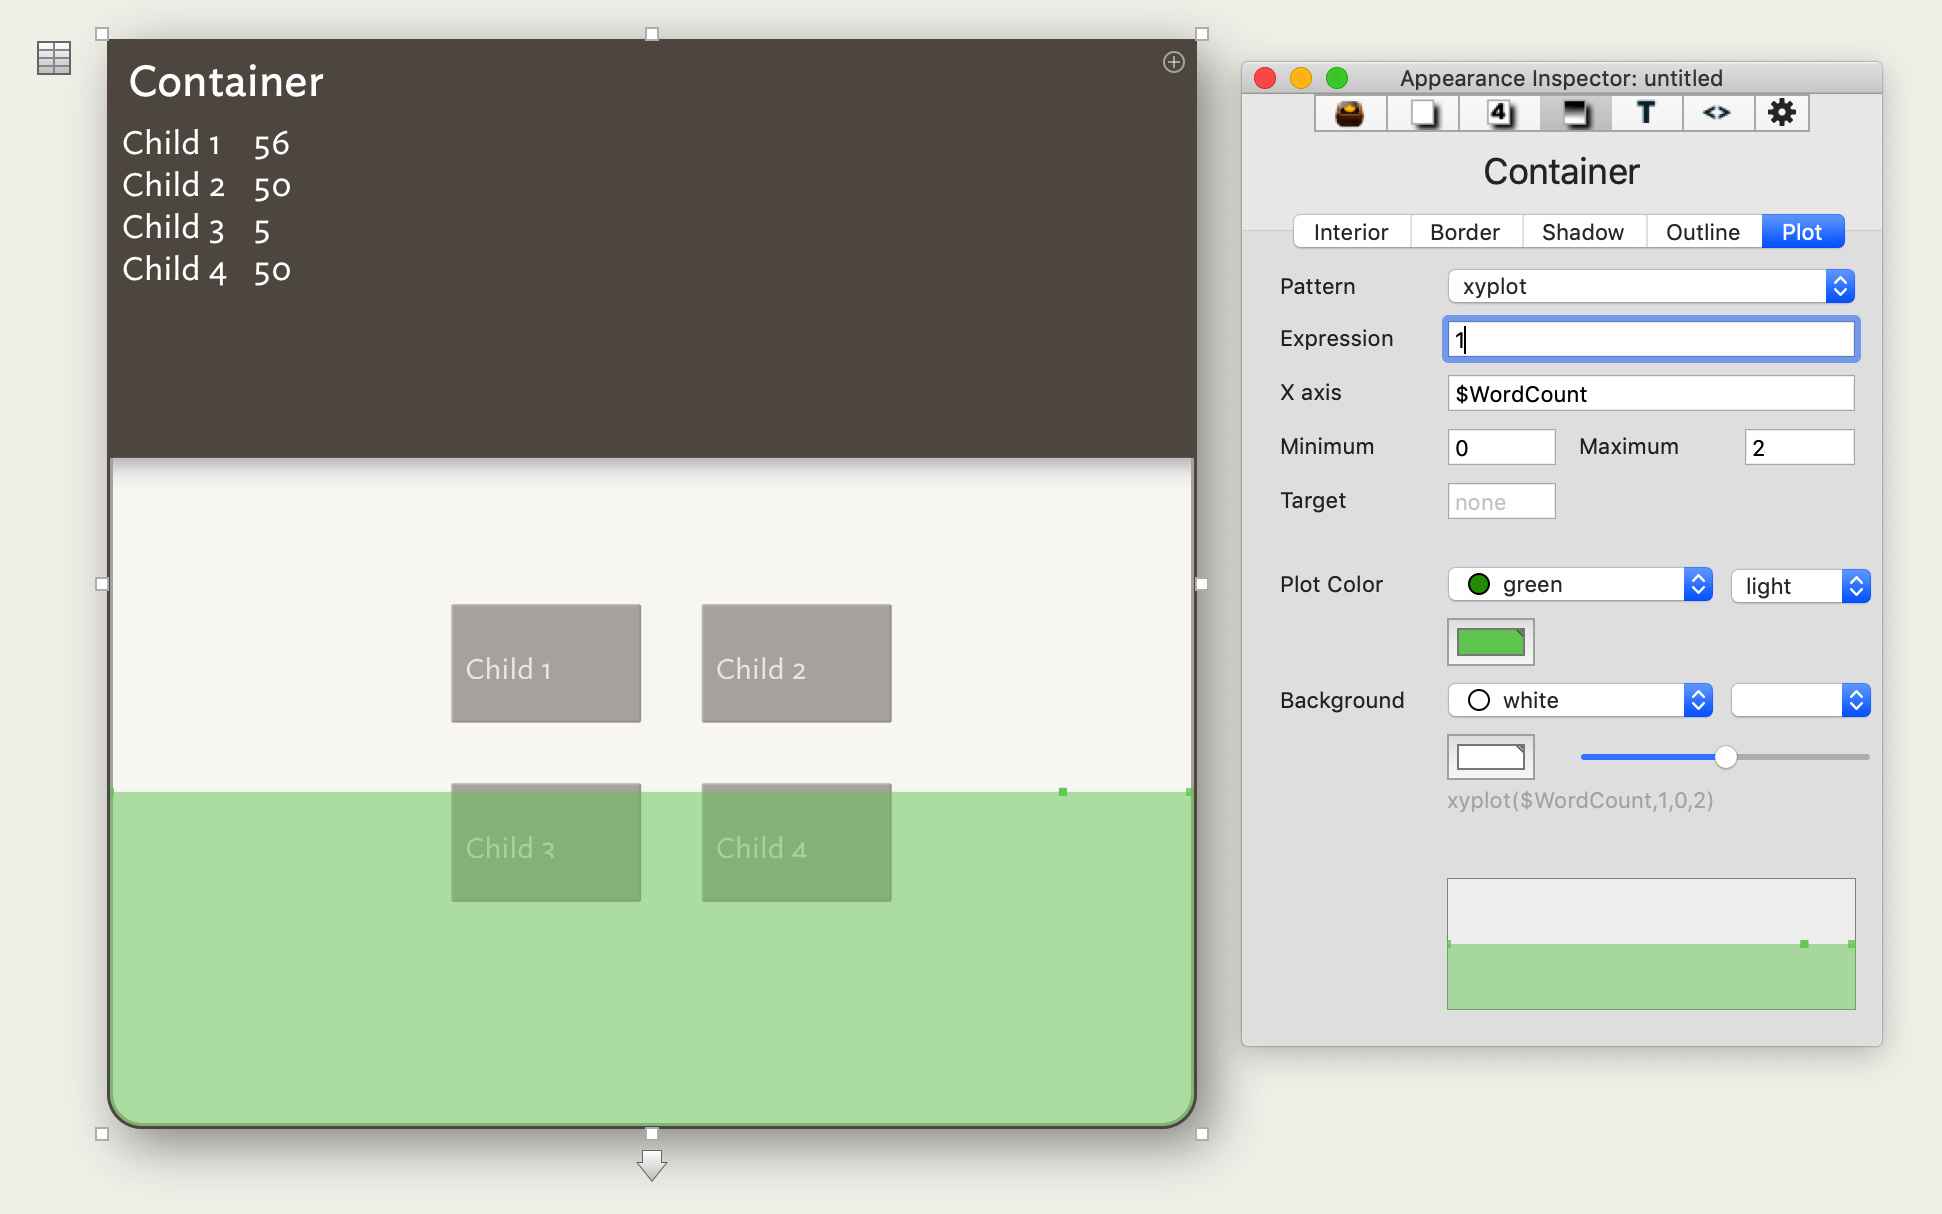
Now, what if we wanted a histogram of wordcounts instead? This would mean that the x value should now be $WordCount, and the y value should be the number of notes that have that wordcount. Setting the x value is easy; just plug in the correct attribute. But what about the y value? I think that 1 would be perfectly reasonable – after all, we just need a yes/no marker for whether a note falls on that x value – but this doesn’t work.

There are two issues here. First, Tinderbox does not aggregate the y values when notes are mapped to the same x location, so we don’t see any variation in the plot. The other is that it simply bridges the distance between the plotted points linearly. (The latter is fine, given that we used xyplot, but it does also hint that bargraph might benefit from an xybargraph version.)

Aggregation is a solved problem with a standard solution: you provide a reduction function which describes how to combine values. Such a function needs to take a set of values to a single representative value, and is called for each x in the plot with the set of values that mapped to that location (which may be the empty set). Consider how we would implement the histogram. We need to get the count of the notes for each x location, so we have each one contribute 1 to the set. Then we take the sum of all the 1s at each location (the sum of the empty set is 0). For my OP issue, where I want to see the issues resolved on each date, I would use $Date as the x value and do the same.

As another example, motivating more expressive operations, if we wanted to visualize entries in a lab notebook we may want to plot the mean of the note values along some axis.We would need a more complex reduction function which finds the sum of the values and divides by their number. Another view may plot the variance or standard deviation of the data, to help eyeball whether the results are significant.

Unfortunately Tinderbox doesn’t have a way for users to define their own functions. In Emacs, by comparison, sum would be trivial to implement as the lambda function (lambda (vals) (apply '+ vals)), as would mean: (lambda (vals) (/ (sum vals) (length vals)). Tinderbox action code would require another attribute to be bound during the execution of the reduction function so that the set of values could be referenced. (Perhaps $PlotYValues or something.)

Anyways, in the plotting case I think sum makes a pretty good default: it reveals when there are overlapping points and handles most cases pretty well. Adding more complex expressions is probably required if sum doesn’t get things right. Right now the behavior seems to be “pick arbitrarily” which is confusing, but also could be easy to implement as a reduction function.

I hope that clarifies things a bit!

2 Likes