Thanks, so it looks like I’m on track with the boolean approach, as noted yesterday, that is good to know. Must finally be learning. 
In terms of process and methods, however, I’m curious and have some questions and would like to share a few of the methods I’ve already started to use so that others may benefit.
Also, some background. I know nothing about this data. A friend gave me a huge spreadsheet and asked if I could help make sense of it.
My first step has been all around the effort of tenderizing the data to get it ready for consumption, just like a good steak.
Methods used so far,
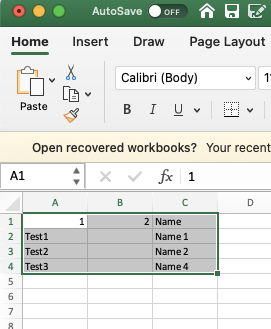
1. Import Spreadsheet, I started with a spreadsheet. 417 rows and 11 columns. I simply copy all the rows and columns (be sure to select the headers) and paste them into a new Tinderbox. This creates a new note, “container,” called “imported spreadsheet.” Each row of the spreadsheet is added as a new note to the container and all the columns and their respective data are added as attributes. If the column name in the spreadsheet already matches an existing system or user-attribute Tinderbox is smart enough to use it and populate the new note with the data from the row’s corresponding column cell. For example, Tinderbox will use the data in columns labeled Title or Name and populate the $Name attribute with this data. If it does not find a column named Title or Name it will use Column 1 as the name of the note. If Tinderbox does not recognize the name of a column it will automatically generate a new user-attribute with a Type string. I then open Document Inspector, ⌘1, and modify the new user-generated attribute types as needed, e.g. make URL’s into Links, Sets into Sets, etc.
For example,
This,
Becomes this,
**2. See what I’ve got, next I want to see what I’m working with,
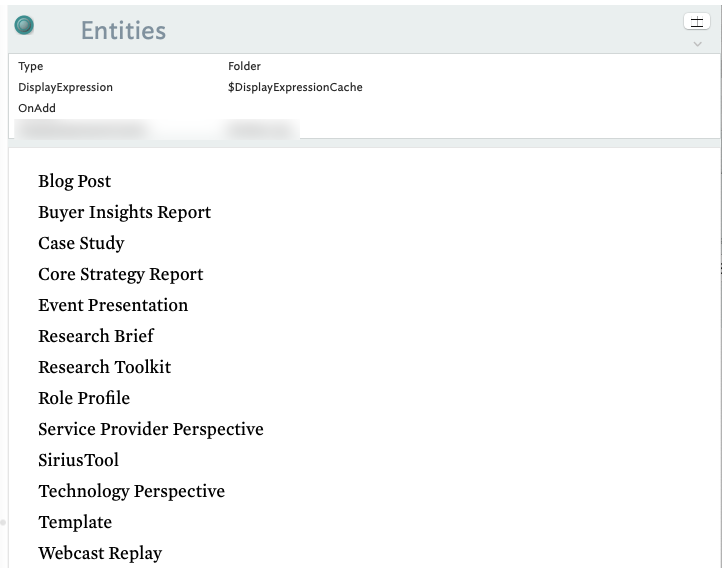
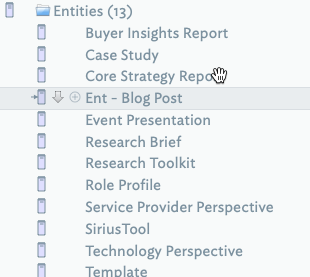
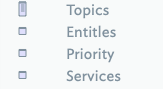
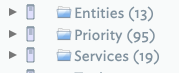
2a. What values are in the sets, I manually create notes based on the names of the user-generated attribute sets, e.g. Topic, Priority and Services (In my case I had previously created a Folder prototype and applied a $ChildCount to the $DisplayExpression).
Next, I [create a stamp(Stamps) to pull the values out of each set and then apply it to each namesake note. The goal here is to create a list of the attribute values in $Text (Remember: you need to change the user-generated attribute from string to a set otherwise you end up with tons of duplicates. In my case, in one example, 1,800 items vs. 95).
Here is the stamp:
$Text=values("$AttributeName").format("\n");
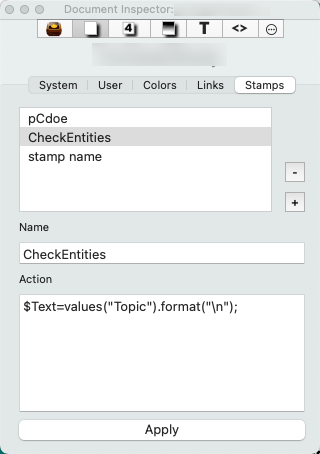
For example, this stamp $Text=values("$Entity").format("\n"); produced a note with this text:
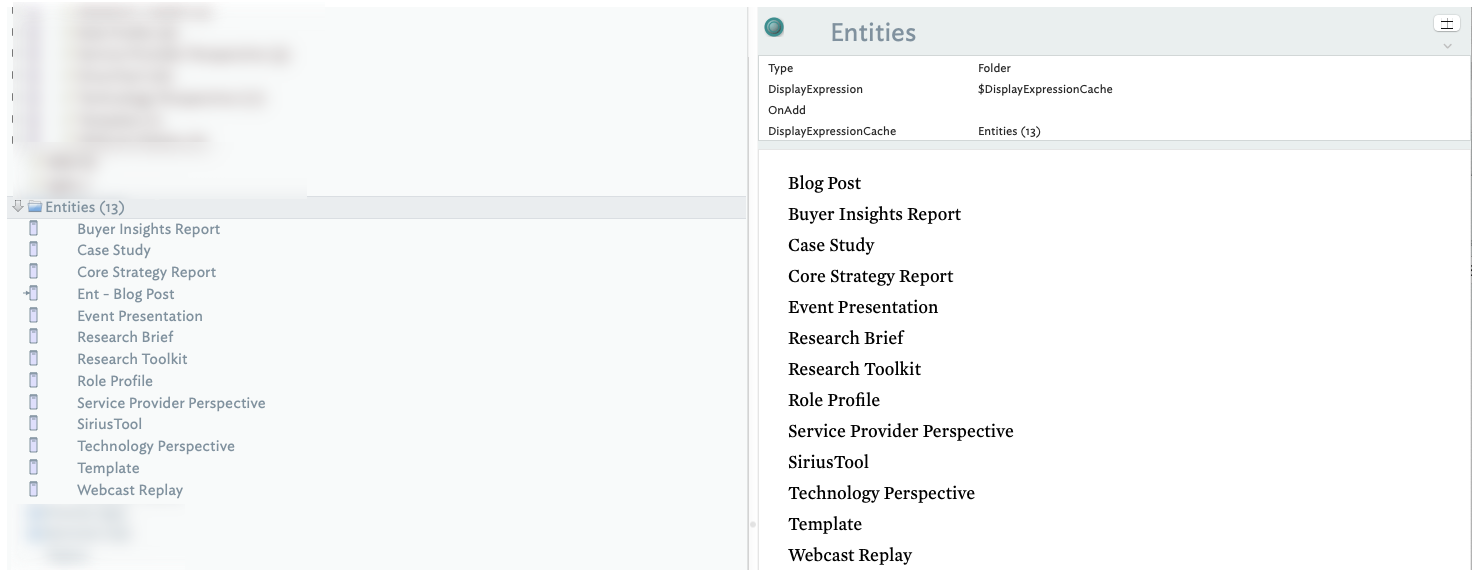
Next, I explode the note to get each entry to be its own note.
I go through this process for every set or attribute whose context I want to analyze.
*3. Run some queries
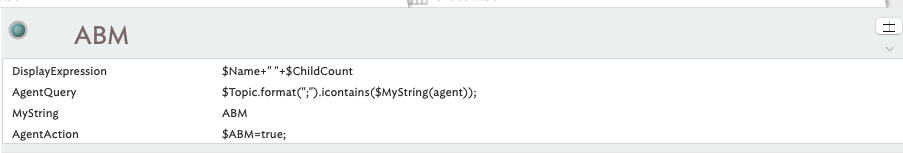
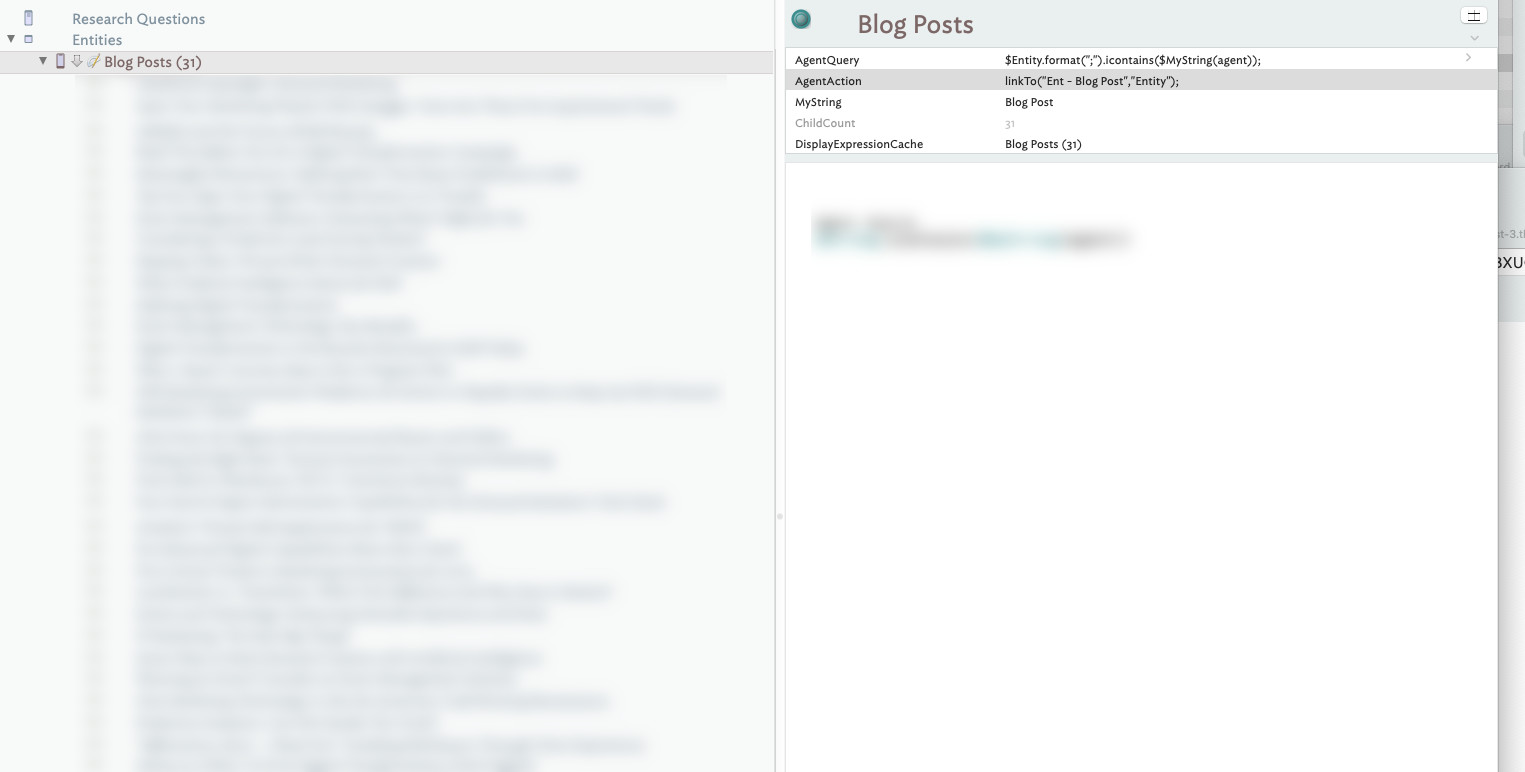
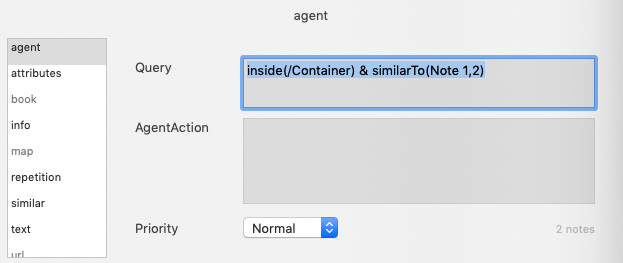
Once I get a sense of what is in the sets, I can then run some queries on key terms I want to tease out, e.g. “ABM” or “Blog Posts.” The key here is to start to quantify the file and get an idea of how many notes related to each item. To do this I create an agent and run a query. Here is an important trick. You can’t run partial text-searches on sets, set searches want exact matches. To get around this you can use a dot operator that formats the set to a string on the fly, like this $Entity.format(";").icontains($MyString(agent));. The .format(“;”) changes the set Entity to a string, which enables partial text searches.
So this,
Results in this,
Like above, I do this for each of the queries of interest.
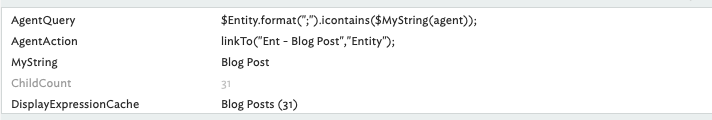
Also, as noted above, I created the ABM attribute and others, applied an agent action to set the attribute to true. Querying on true-false is a lot easier than running a bunch of .icontains searches.
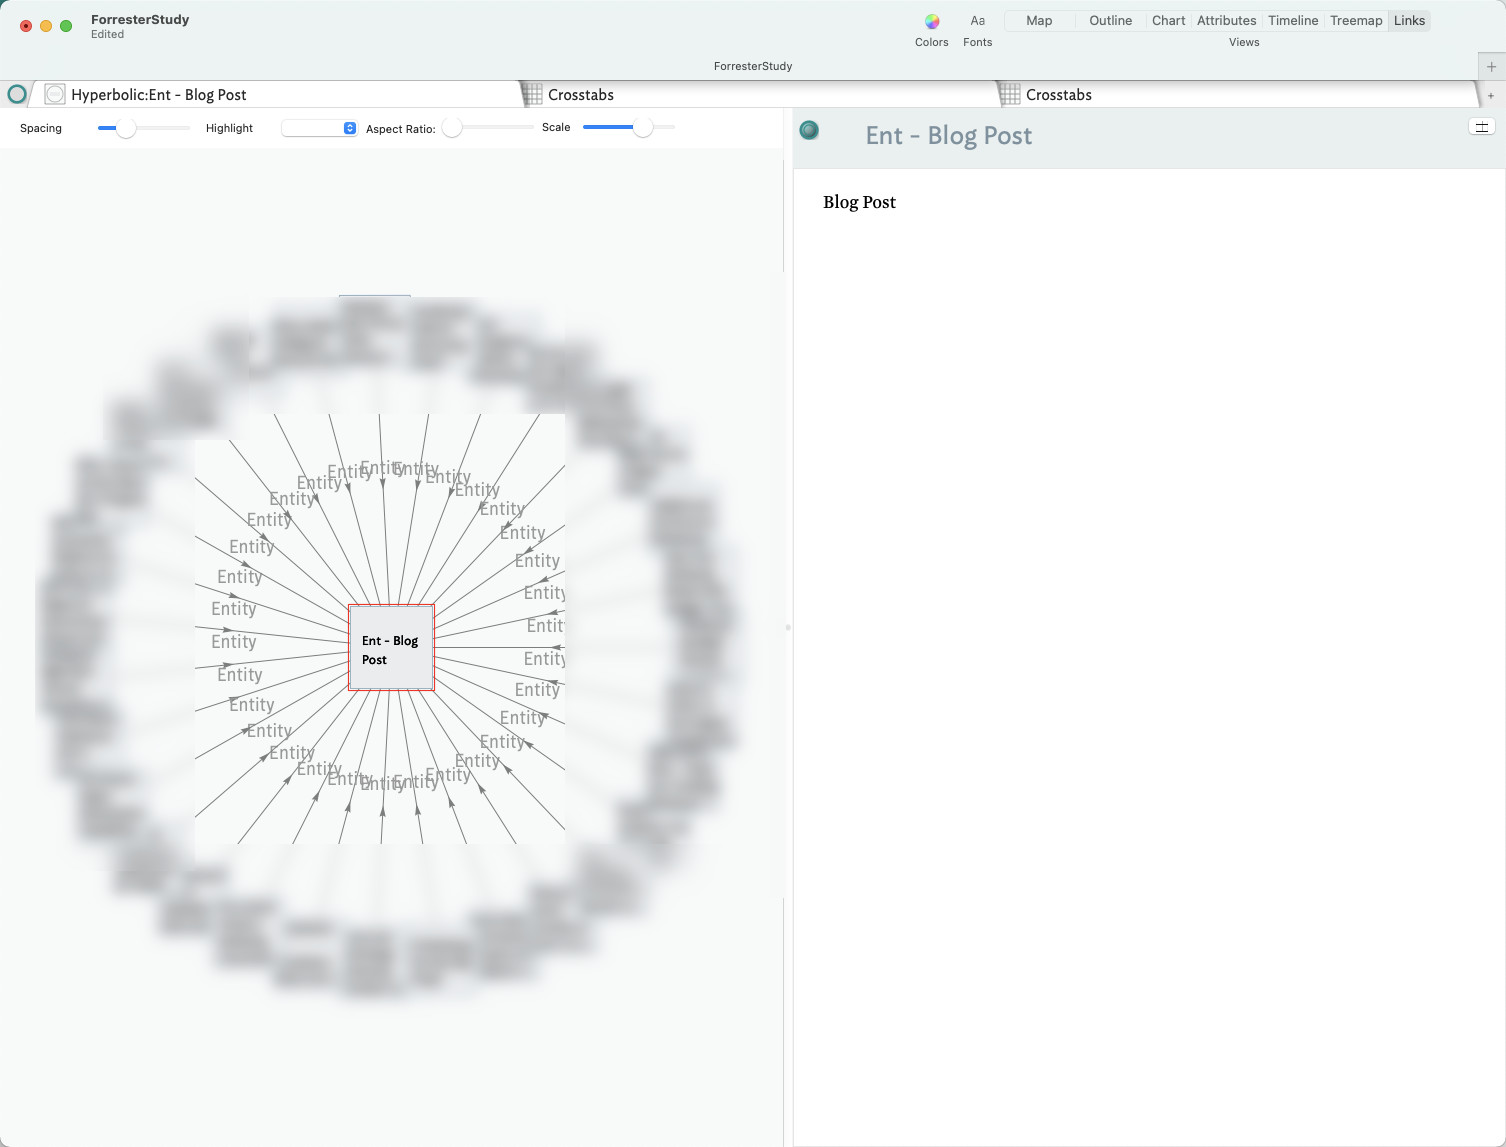
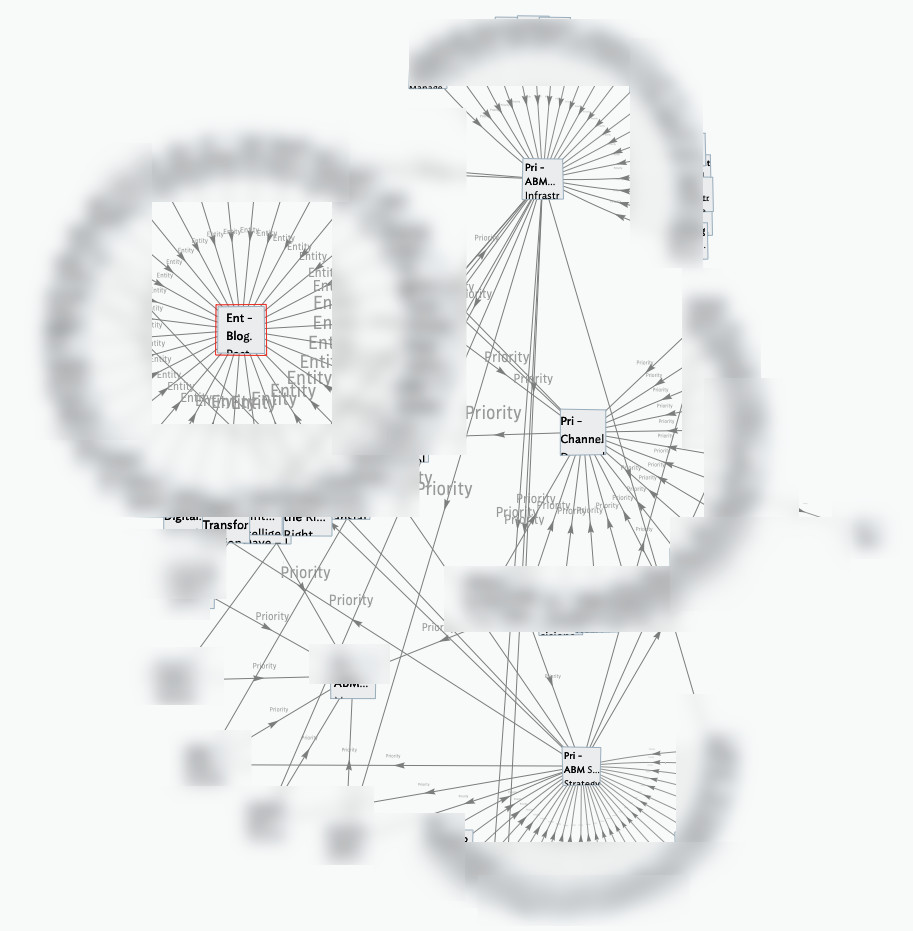
*4. To make visual sense with links,
Next, I tried to make visual sense with links. As you can see above, in one of the queries I’ve tried using a linTo() action to link entities to their respective notes. This lets me view the relationships in a Hyperbolic, “link”, view.
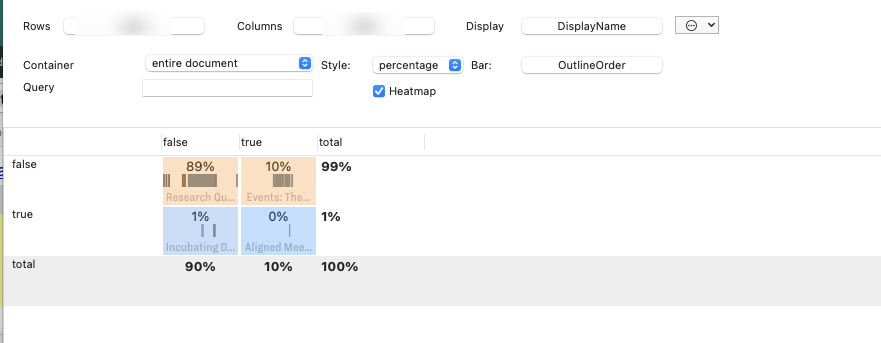
*4. Cross-tabs,
Now that I have my boolean attributes I can easily run cross-tabs,
As for cross-tabls, this will prove very useful, and I see that I can run a query, but they don’t let me apply actions like you can on AB, so there is a limitation here.
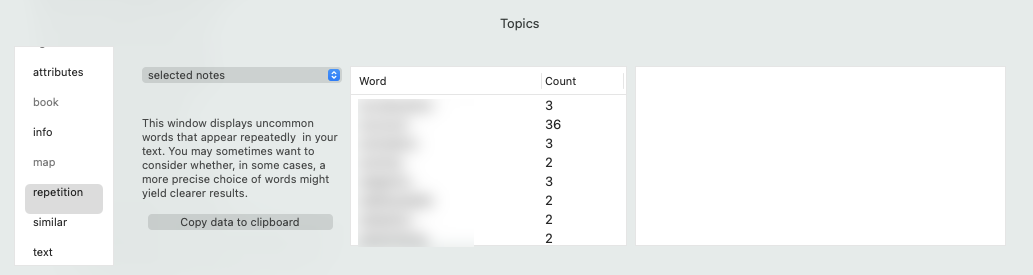
- Word repetition and keyword visuals,
I’ve also run some keyword visuals,
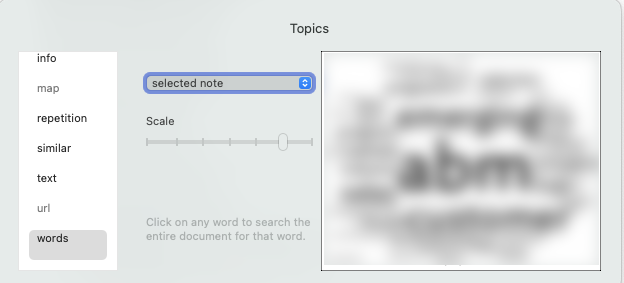
and work repetition to help me get a sense of the data,
That’s it so far, this is as far as I got with about an hour of work (it has taken me longer to write this post than to do the work). What I started with was a spreadsheet with a bunch of data and what I have now is an interactive data set that I can apply views to and manipulate to tease out insight. Isn’t Tinderbox cool!
As noted above, I have one exploded set with nearly 600 items. My next step will be to figure out a way to consolidate some of the items into more manageable cohorts. I’d like to future our way to automate this a bit. For example, I think I can create some arrays of items and aggregate them into lookup tables to make the associations faster. I also need to go back to my friend to get a sense of what he really wants to know. In reality, all I really have at this point is a bunch of data without clear questions.
Anyway, if anyone can think of any other creative ways of parsing and out and making sense of a big dataset like this, I’m all ears.
Thanks, and I hope the above explanation helps others.