I cannot for the life of me figure out how to put bars and plots correctly on a note. There are two things I am trying to do.
First, I have 400 notes or so inside a container with user attributes $Good, $Bad and $OK. I want to put 3 bars on the container that show how many of the notes with each attribute it has. Each bar should reflect the percentage of its attribute – e.g. if 100 notes are $Good the bar should be colored 25% of the way. This should be fairly straightforward.
Second, I have a TBX file that I want to use to keep track of blood pressure. I have notes inside with 3 user attributes: $DateAndTime (when the bp was taken), $Systolic and $Diastolic both of which are obviously integers. On the container of the bp notes, I would like to plot $Systolic on the y-axis and $DateAndTime on the x-axis. I can get a graph of $Systolic if I put $Systolic on the plot expression menu, but it just plots all the points of $Systolic and does not use $DateAndTime. Is there any way to do this?
Are the samples at fairly regular intervals? One approach to the blood pressure chart would be simply to sort the container by $DateAndTime.
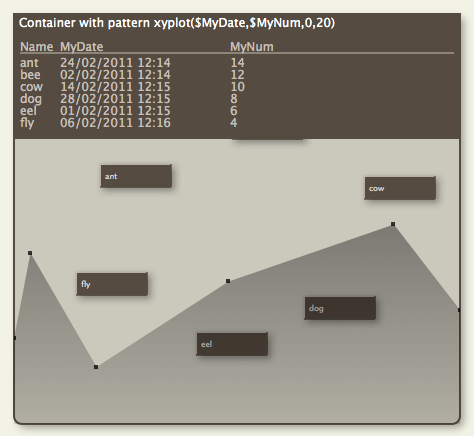
If you want to do an XY plot, set the pattern to xyplot, the Expression to Systolic, and the X axis to $DateAndTime, which I presume is a user date attribute?
Thanks, Mark, for getting back to me so fast. I think I should use Excel or Numbers for the BP – Tinderbox, marvelous as it is, is not made for the kind of graphs I am thinking of. But my other problem, with the bar plot, is exactly what Tinderbox does best, and I am hoping it is possible. The documentation doesn’t say much about what the expression should be in the plot tab of the appearance inspector. I would like to have 3 bars on the container in map view that would show me the percentage (of the whole # of child notes) taken by the child notes for each user attribute. I seem to remember seeing this in a Tinderbox video someone made, but I can’t find it. Let’s suppose there are 100 notes in the container and 25 are $Good, 25 are $OK and 50 are $NotSoGood. Is it possible to put 3 bars on the container showing 25% for $Good, 25% for $OK and 50% for $NotSoGood?
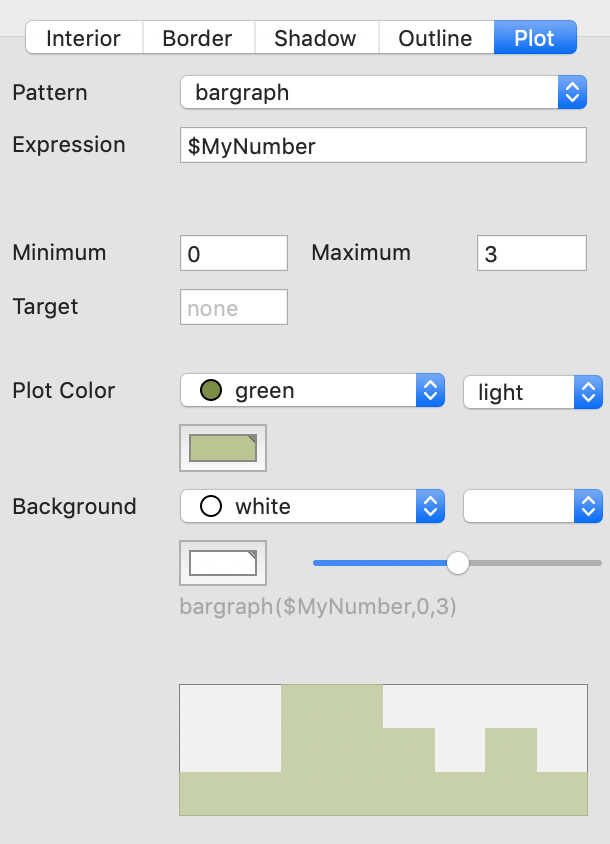
You are correct that container plots aren’t an open charting space; rather they can plot values of their children. Here I’ve 8 child objects with 4 and ‘NotSoGood’ recorded as $MyNumber value 1 (plots plot numbers), two with OK as $MyString 2 and two with Good as $MyString 3 which we can plot thus:
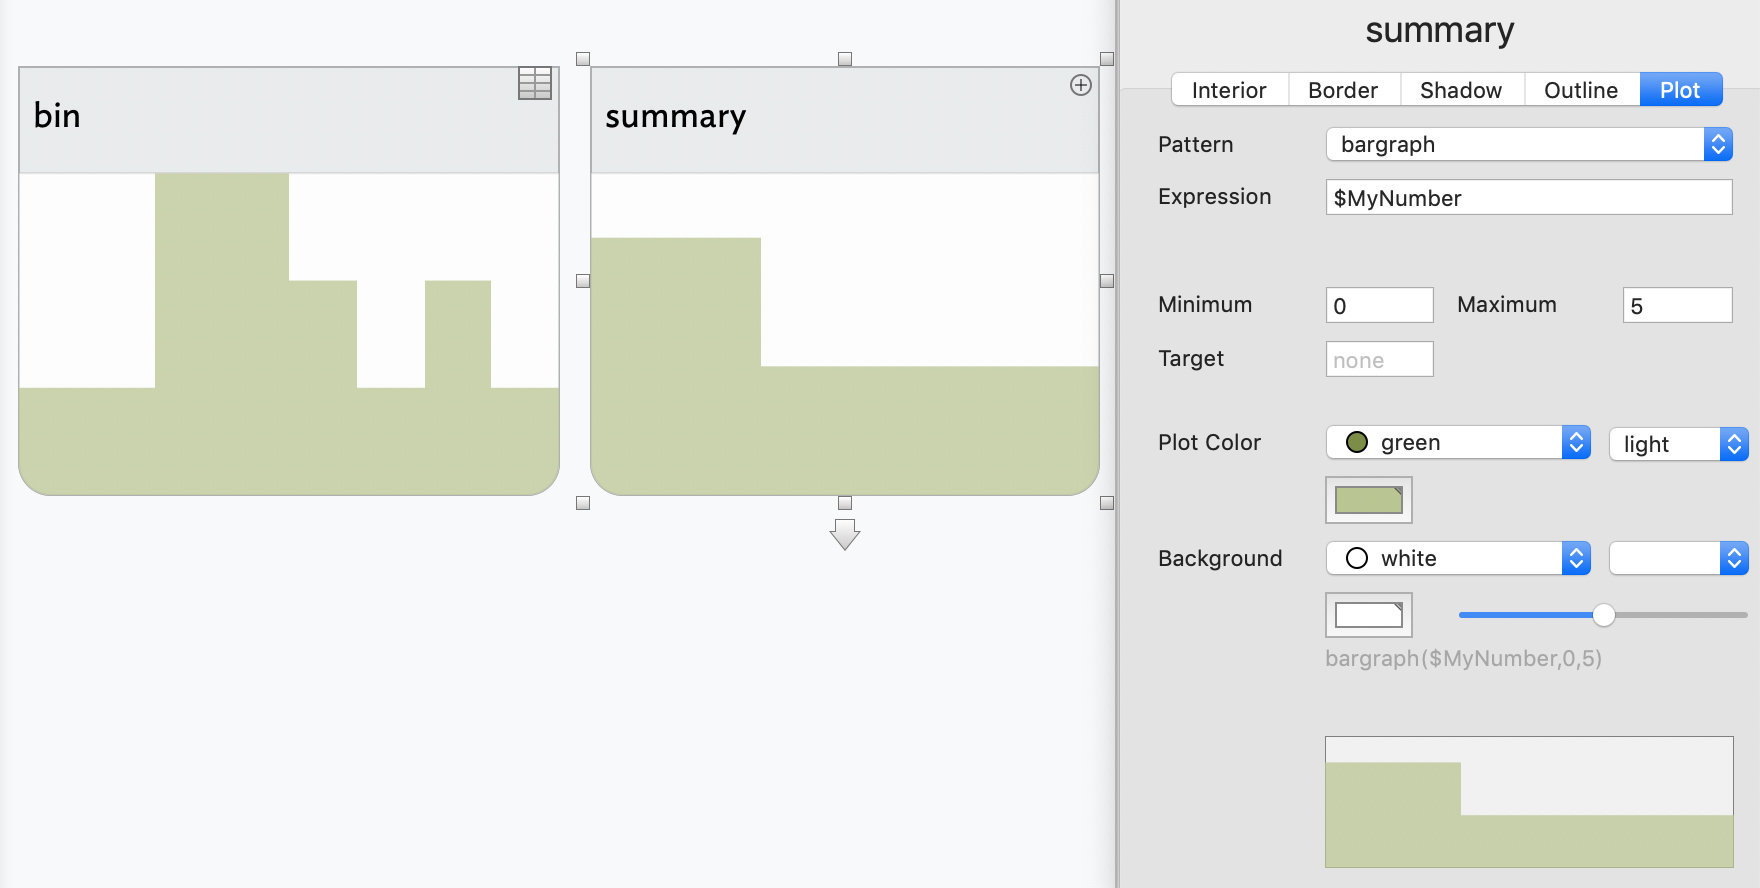
But, you want a plot of aggregated wellness values. One solution is to make a separate container with 3 children, each of which summarises one of the 3 wellness states via an edict. For example, for ‘OK’:
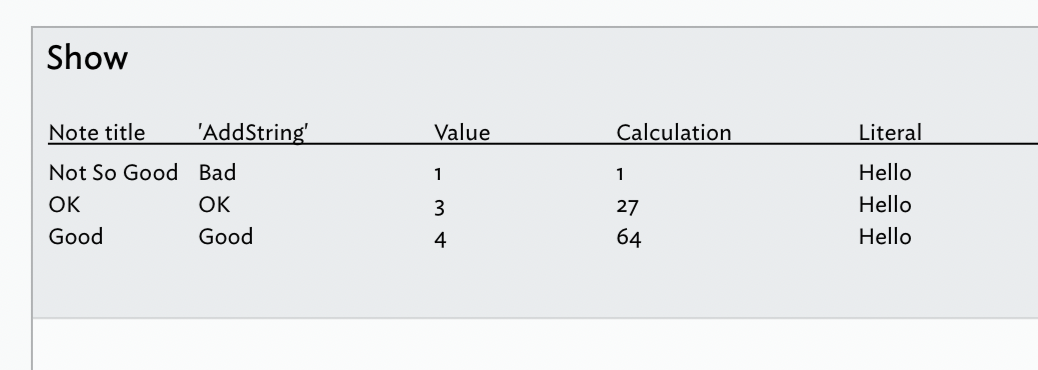
It’s also worth mentioning, these container [sic plots are representing content so there are no labels on the plot but you can make container tables to summarise the plotted content, e.g.
Note that if you don’t want to see the notes in the child mapshowing through the plot, click into the plot are and drag-scroll it until the underlying map items are outside the container’s viewport.
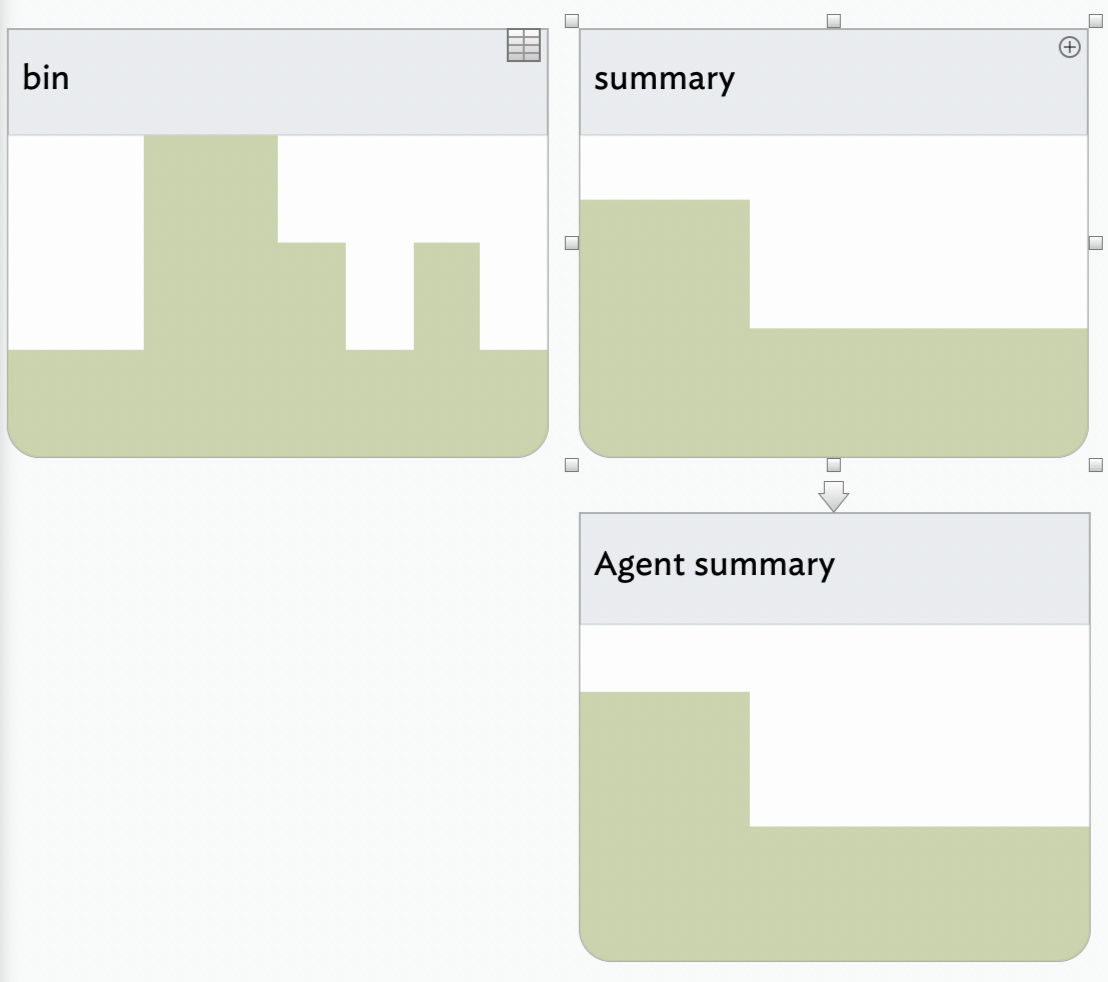
My rationale for agents is that once the size of the document rises so does the number of aliases floating about. In turn that can mean queries need to be a bit more careful and alias containers need to be small. Here we have 8 source notes, and from our agent approach 8 aliases. This is fine, but if we have 4,000, we’d also have 4,000 aliases. This too is not a problem, per se, unless you want to look at the contents.
So, agents are an easier way to start and fine for most documents. As a document grows in (note count) size, it may be useful to know of the alternative approach presented in the file.
Thanks to both of you, Mark B and A. I believe my best solution is not to use a bar graph but a container table. I’ll work on that, using your suggestions – the demo on table expressions and the code for getting the child count of an agent are very helpful. George
Managed to get what I want thanks to the help from Mark and Mark. Here it is – note it does not use an agent, which seems more frugal to me. Table Count Demo.tbx (89.4 KB)
I should add that what makes this hard to figure out is the fact that the same variable is used in the rule for each note that is evaluated inside the “Show” container. The value of the variable changes for the three notes in the container, and those changes are reflected in the table. One would expect to need a new variable (with a different name) for each note, but Tinderbox apparently just evaluates the same variable differently in each note.
I think the confusion arises in your presumption of there being variables†. Just as notes have discrete titles, i.e. $Name values. Ergo, the value of $MyNumber is one note is not that of another.
† Action code does have a method for temporary variables, see ‘var’, although even there it is not used in the manner you describe.
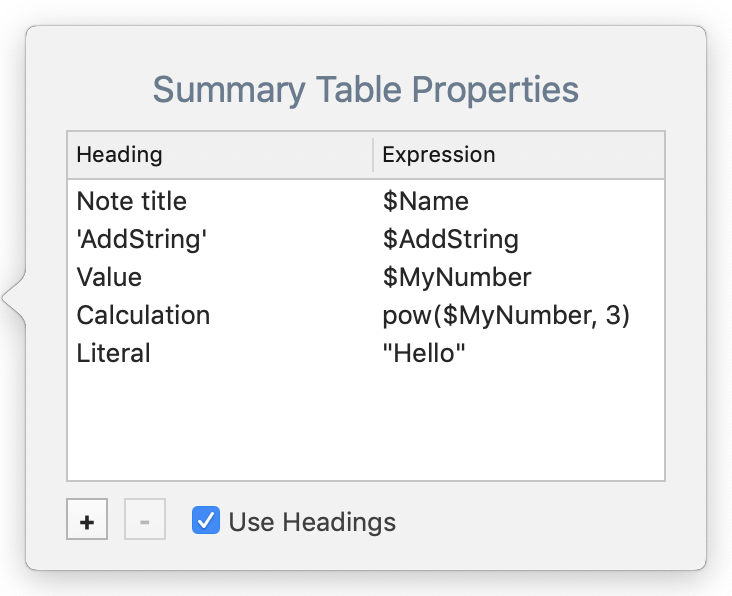
I think you have misunderstood how to set the table. You don’t ‘compile’ each row of data. Instead simply place a value (literal, $-prefix attribute reference or an expression)
Here, I’ve adapted your TBX to demonstrate this. This is the set-up dialog
Yes, the way you point out that the value of $MyNumber is for one note only, like the name of the note, makes it clear. Just tried it out on my big file, and it works perfectly.
One other thing:when I put all the instructions for counting notes in Rules, suddenly after a while my 16" MBP had its fan running full speed. I looked at Activity Monitor, and the problem was Tinderbox. So I changed the instructions to Edicts, and that worked except that edicts update only once an hour or so. It would be useful, I think, if edicts could be set to update at a given interval (e.g. 5 or 10 minutes). George
The point of edicts is they run infrequently so as to not load the app as a rule might. However, if a note (or—I think—any of its KAs) are edited the edict fires. More pertinently calling File menu → Update Agents Now will also refresh all edicts ones. Individual edicts can also be run once, on demand, via the Edict Inspector.
When using an action such as find() or collect() in a rule or edict think carefully about your query structure: see here, section on ‘Making Agents More Efficient’. Ideally search as few notes as possible at each step, noting that .contains() queries use regex and are more resource hungry (so put as the last test, if possible). If lots of notes (via rule) are constantly polling all note in a large TBX, fans will result. This is a good example of what is a trivial difference in approach in a small document may need tweaking in a bigger, busier one.
Thanks – had not realized that update agents now works with edicts also. I’m quite pleased with how well my TBX file works now. No other program would work for what I need – TBX, after 2 days’ work getting everything together and figuring out how to set the edicts and rules, works perfectly. The trick for me was to put in some of the data without any programming then adding the programming as I discovered what I need to do. One thing I found: it is good to keep previous versions of the file in case something doesn’t work out. Dropbox works well for this if you pay a bit extra to preserve earlier versions of your work.
For later readers of this thread, it is worth noting that it pre-dates map view Posters. The latter can overcome some of the restrictions discussed.
As posters allow much more control of source info (they do not have to draw from their children) they offer a bit more plotting flexibility. The latter comes at the cost of the user doing more configuration work. But, a valid alternative to container plots.