I would like to use a matrix to cross notes according to any two Tinderbox attributes. The otherwise very useful Attribute Browser doesn’t offer this kind of view. I would be happy to view it as an Excel sheet.
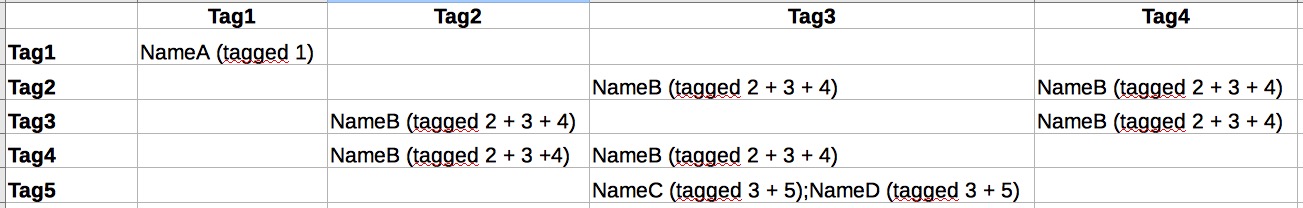
This kind of grid is used to keep the analysis focused on the original study design. It allows to easily identify notes to remove, because they don’t match reasearch questions, hypotheses or whatever other attribute, as well as to identify gaps that are not covered in notes. In the attached image, there is an example of crossing tags to tags.
I know how to export from Tinderbox to csv, but can’t think of a way to automatically process the data before export in order to get a csv similar to the attached example. Is anybody else using a research grid, or could advise how to approach this task?
Excel is very good at creating crosstab views of your data. If I were doing this I would do a tabular CSV export from Tinderbox, bring the table into Excel, and use its crosstab feature. It saves a lot of headache to use existing tools rather than code your own.
Yes, an app like Excel would be good. But it seems that Cross Tabulation and Pivot Tables calculate the ocurrences in the intersection. What I would like to view in each intersection is a list of note names. After my post, I’ve found a similar discussion, but also on numbers not text, in co-occuring set values across notes, followed up with example code. I have also considered using mysql with Sequel Pro.
Whatever route to follow, the normal csv export described elsewhere is not adequate. I need to get a note repeated for as many times as values in each of its attributes. So for NoteA,Tag1;Tag2,Theme1;Theme2, the exported csv file should have:
My use case: I have around 300 notes for a project, annotated with 50 tags. I would like to view the note names in a matrix, either in TBX or in an external app. First, with tags in both axes, so that I can see which intersections I have missed to plan, and which notes could be merged. Later, tags could be crossed with research questions, research techniques or whatever attributes.
Actually, in the Find Co-Occurring Set Values thread you referenced the discussion is about finding textual co-occurrence in a QDI-type context. That’s essentially the same data problem @jmm has posited above. I suggest reading the co-occurrence thread a little closer and downloading and trying out some of the examples I and others posted there.
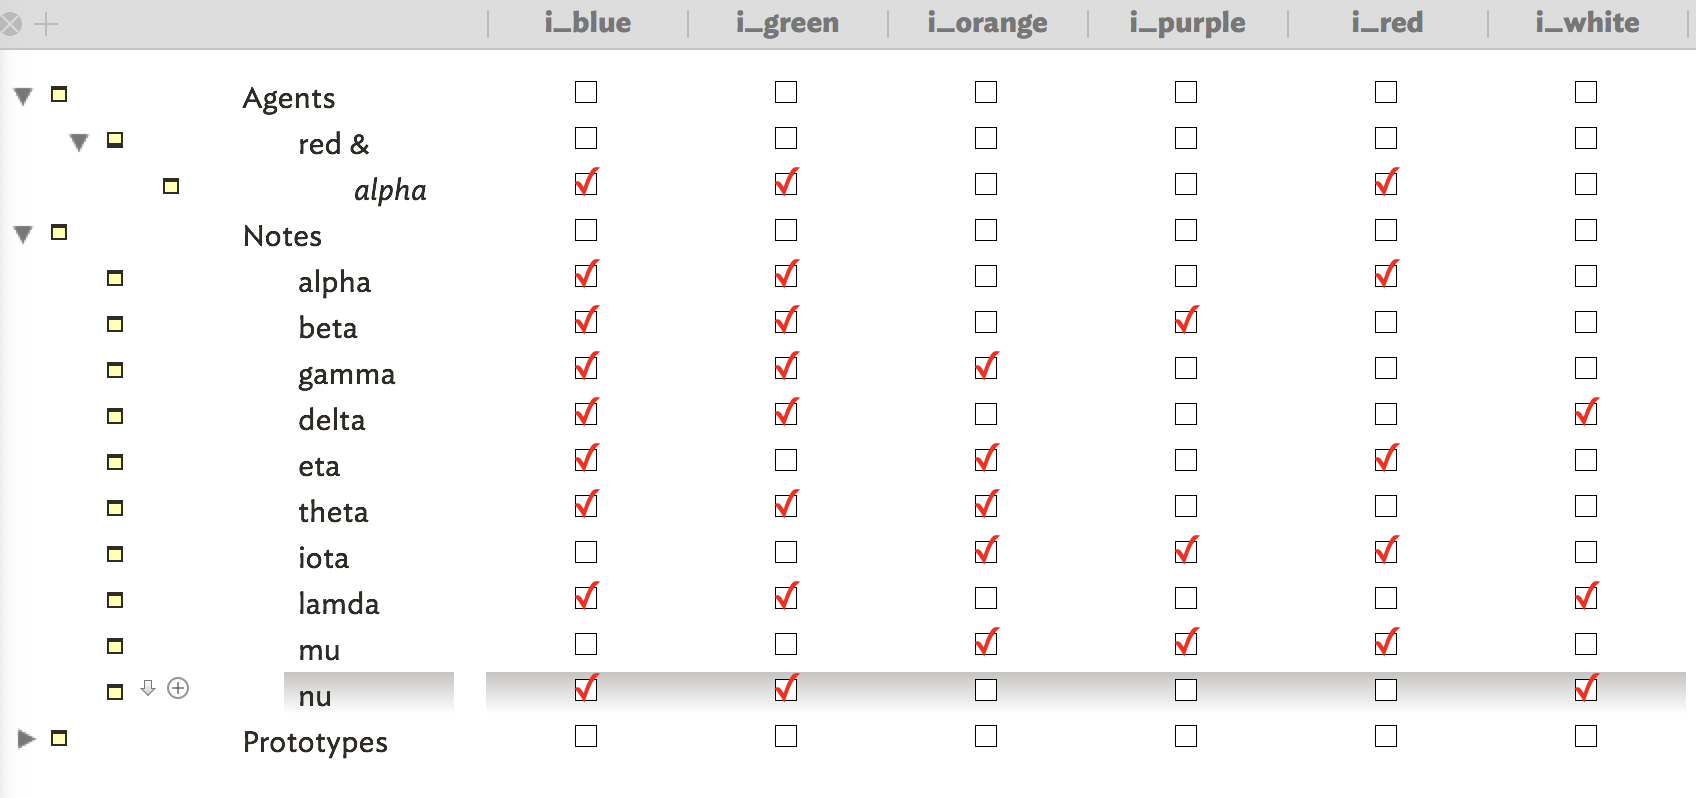
You want this sort of display I believe (this image is not the solution for the notes X tags issue, but the visual is the same). There’s examples in the co-occurrence thread that do that.
In each axis there is an attribute of set type with many values: Tags (horizontal) and Stages (vertical). In the data boxes appear the names of the matching notes.
For me, a 50 by 50 matrix with up to name values in each intersection would be so unwieldy it would be nearly impossible to comprehend. I don’t understand how it is helpful to know every duple out of a set of 50 elements that a given note belongs to. Following the pattern in the original post, that’s potentially 50C2 = 1,225 notes in each intersection of the matrix.
Isn’t the real problem “I have 300 notes that could have up to 50 tags each, and I want to know which tags have not been assigned to this note”? That’s what this reports, as do the co-occurrence examples in a more formal way.
Good luck. Sure would be a bear of an agent to write to the original specs.
I have 50 tags and 300 notes; each note has 2-4 tags. I realised it wasn’t clearly explained when I saw the reply you refer to. Sorry about that.
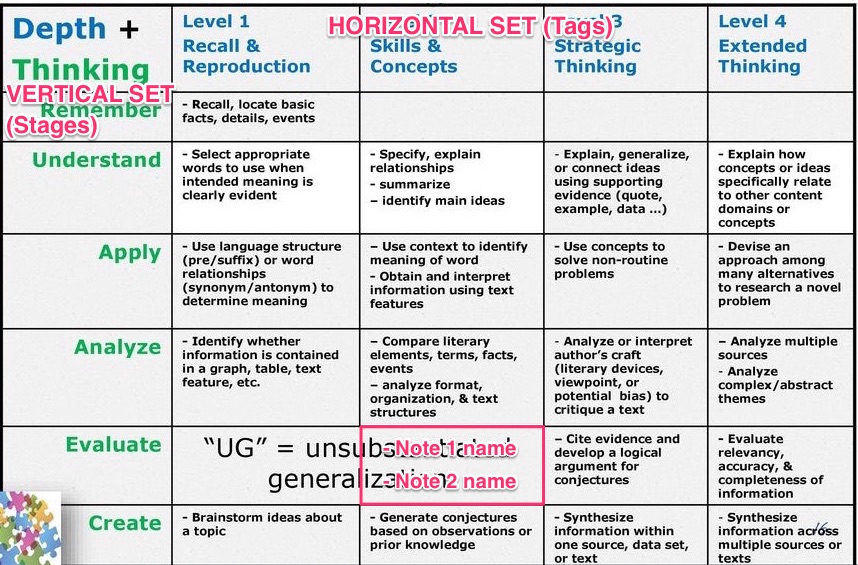
The use case is not far from the one stated here, exception made of the “cluster”:
Your objections were interesting for me. This post is no more than an idea that I would like to see how it works in practice, but lack technical knowledge to implement it. Therefore, your objections to the idea were interesting. And so were your your code notes, that I copied for other uses. So thank you for your replies.