I’m currently trying to build a dashboard that I could use for organizing some of my main projects. I’ve been using Omnifocus for years and it’s a great tool, but I feel the need to be able to have an overview of my projects: not a list of tasks, but a big picture as if I had a corkboard. So, I created a new file I would like to improve with your kind help: could you please suggest me some arrangements I could add to that dashboard? For instance, would it be possibe to add to it an agent that would allow me to know, at a glance, how many tasks I completed for such or such project or a circular ring that would show me where I am in a specific project?
This is the file I created : DB.tbx (79.1 KB)
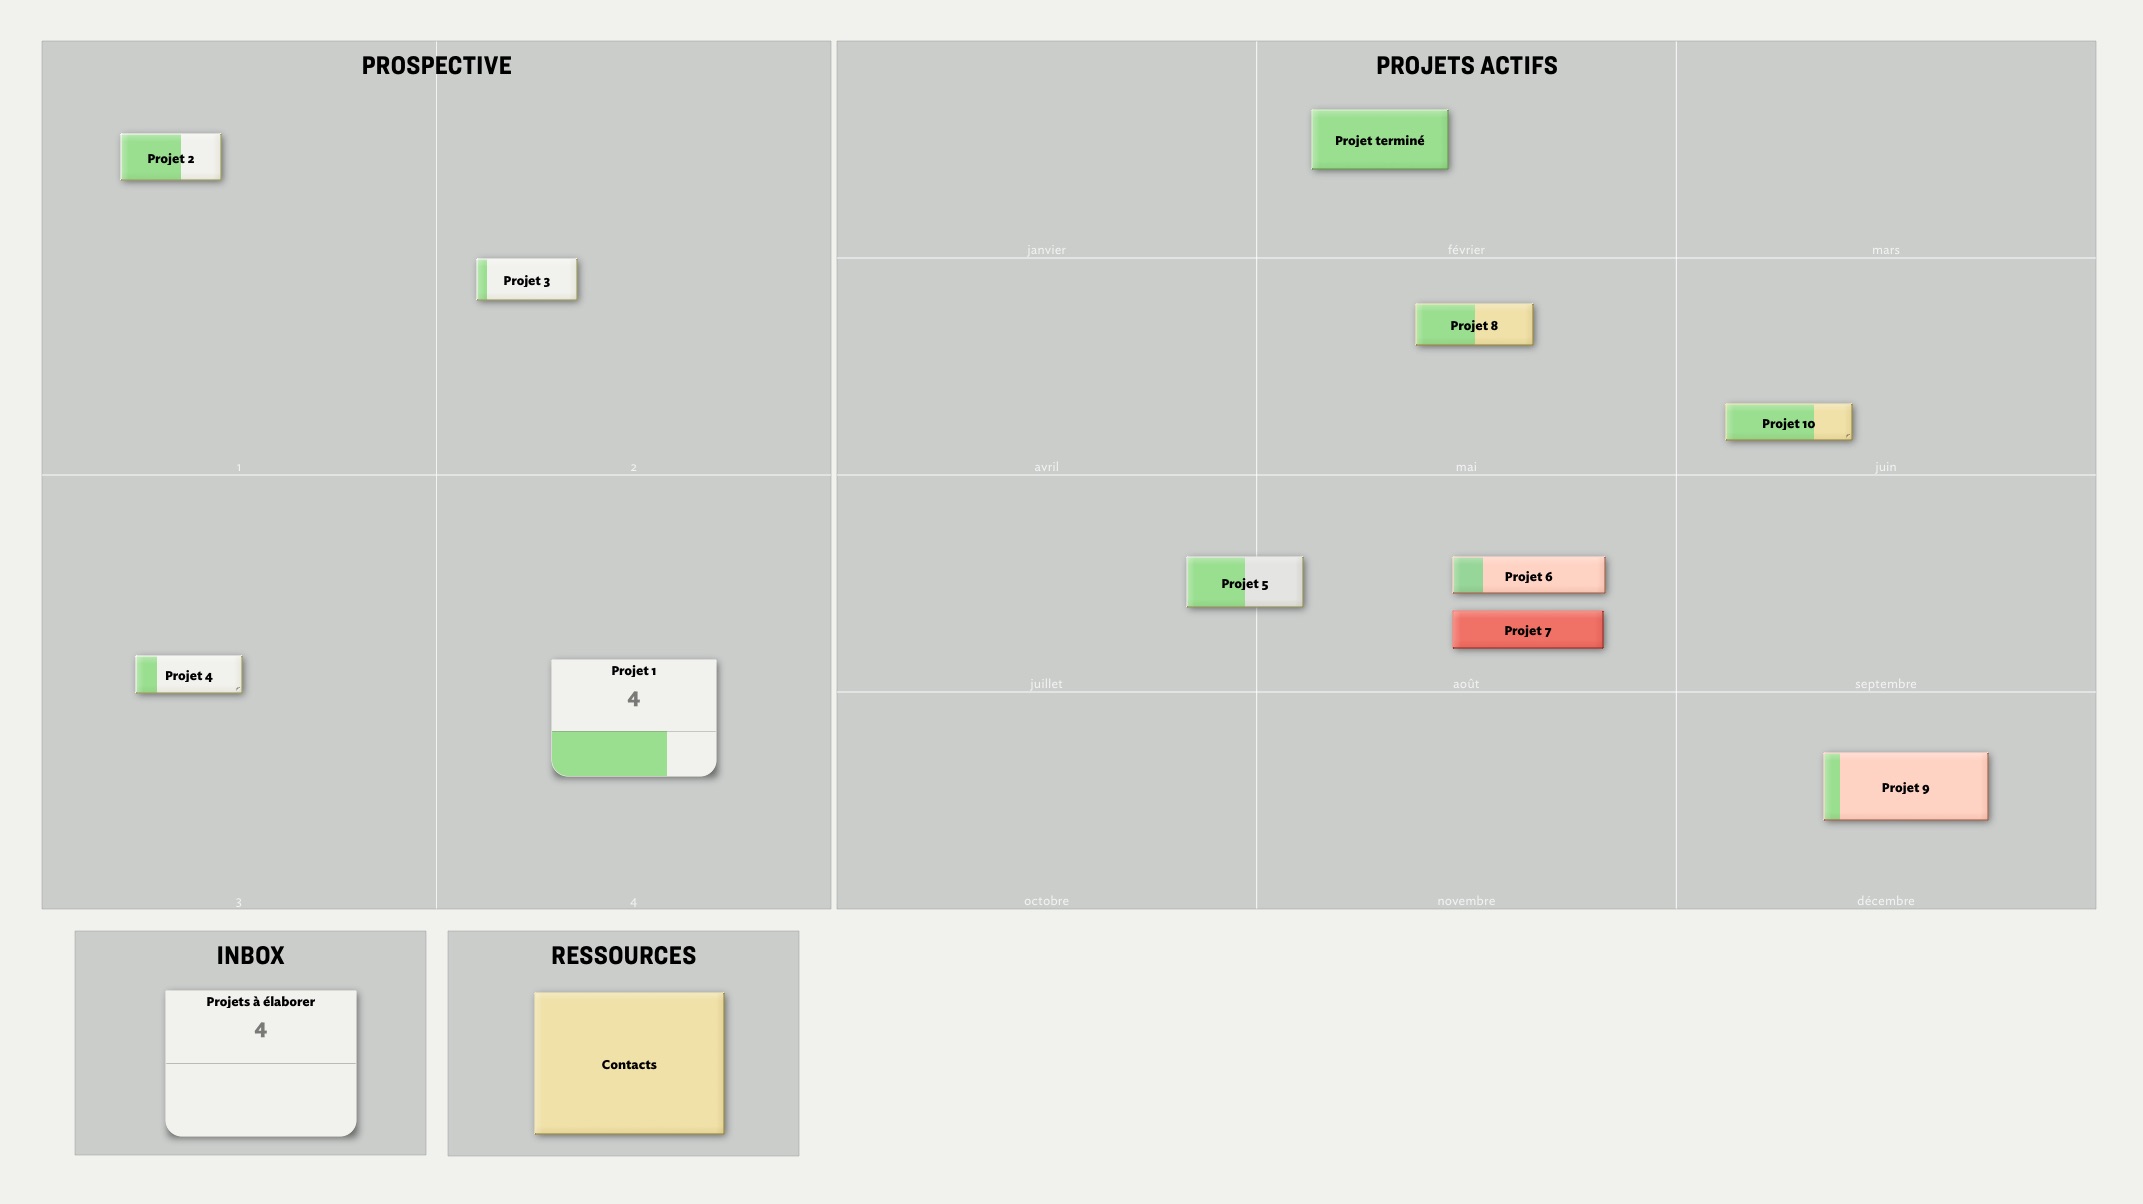
On the screenshot below, an overview of my chief map: this is the window I open to know where I am in my projects. Thanks for your suggestions.
Having prototypes makes querying far simpler. For instance if Project Rouge items use prototype ProtoRouge then it’s easy to find only Project Rouge items using the query:
$Prototype=="ProtoRouge"
Let’s say you use the built-in Boolean $Checked to show when an item is done. Then to find all Project Rouge’s ‘done’ items:
$Prototype=="ProtoRouge" & $Checked
Which is a valid short form of the code:
$Prototype=="ProtoRouge" & $Checked==true
Want all ‘done’ items? Then the query is:
$Checked
The number of matched items is the $ChildCount. There are lots of ways to show this in a map:
As the $Text, but this will be a bit small (see more).
As the $Subtitle - this is what the built-in ‘Dashboard’ prototype uses (subtitles).
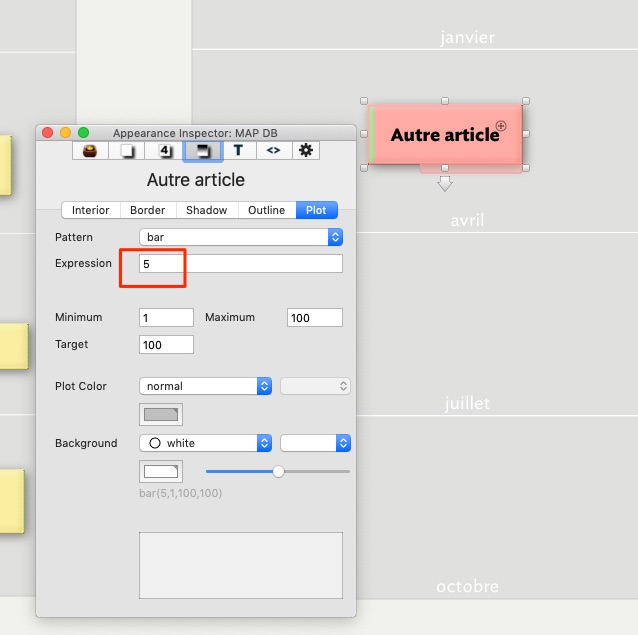
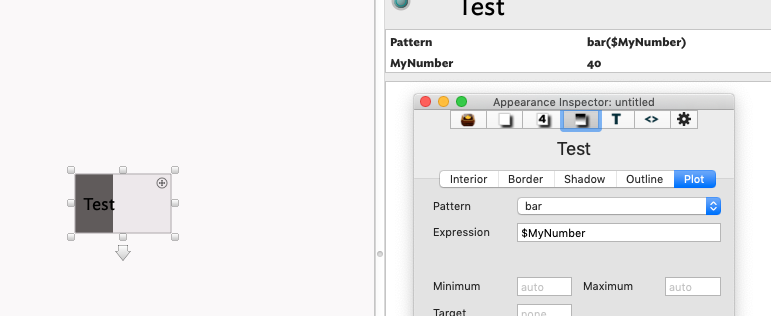
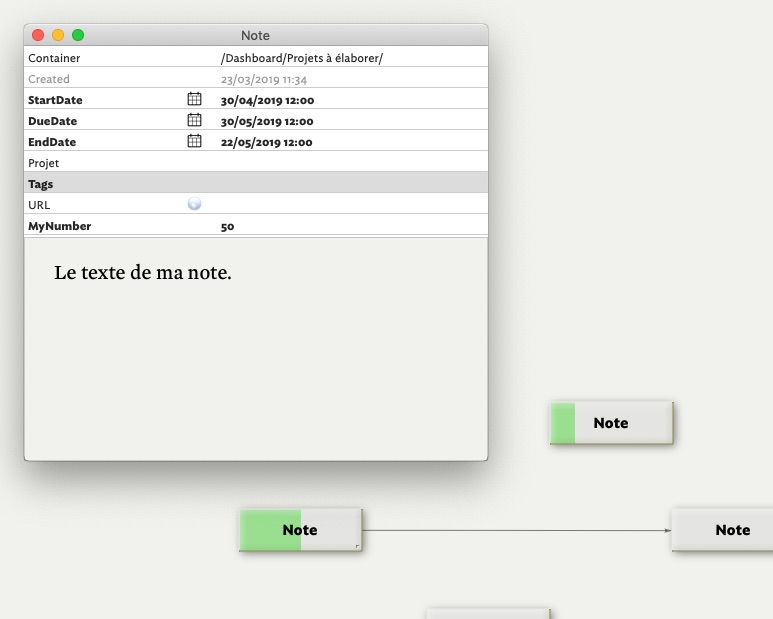
Thank you very much, Mark, for your help, your accuracy and those links. I started bringing some adjustments from your suggestions. As you can see on the screenshot below, if I want to show my progress into a project, I have to enter a number in the Plot section with the Inspector. And I was wondering if there was a way to do it with an attribute. In that eventuality, I wouldn’t have to use the Inspector, but could fill a form directly from the inside of the window of my note as I do when I add some tags to a note. For instance, can I use Expression as an attribute and fill it directly from the note?
I nearly completed my dashboard project and now I’m searching for a process that could allow me to review my projects as I can do using Omnifocus review. Would you have any idea?
Personally, I’ve never used OmniFocus so can’t really comment. But I see the app referenced in the forum so hopefully someone else can step forward to help.
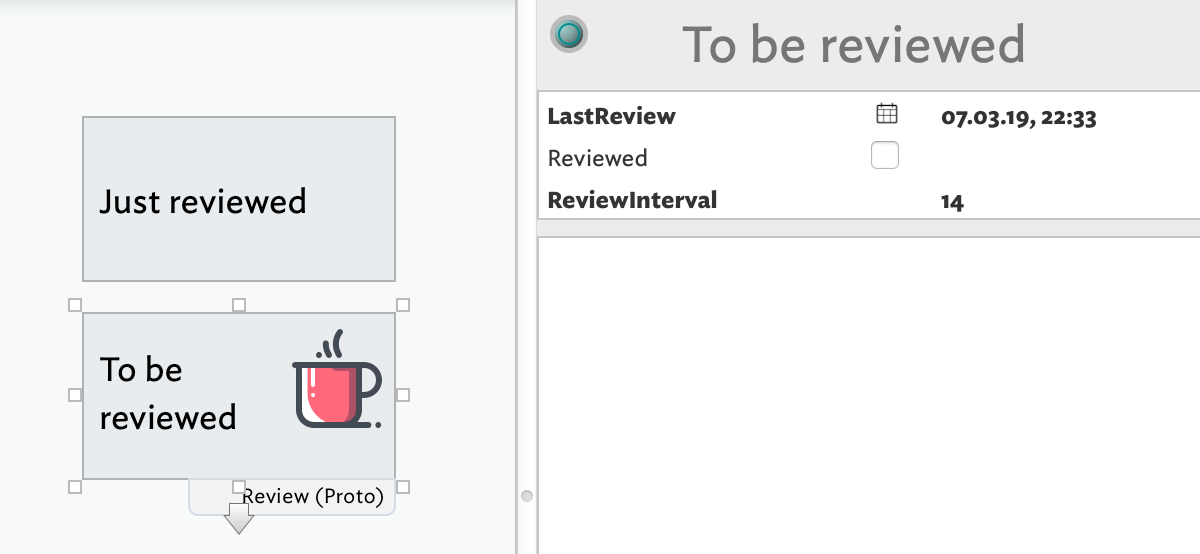
You could add some user attributes to your notes, that should be reviewed:
$LastReview (date),
$Reviewed (boolean) and
$ReviewInterval (number).
When you review your notes, you check off the “Reviewed” KA, then an agent sets your $LastReview date to the current date and removes the check mark again. ReviewInterval would be the number of days, you want to have as the review interval.
Now you create two agents, one that collects the notes, that are to be reviewed and marks them, for example with a badge. And another one, that sets the review date and removes the badge and the check mark again. They would look like this:
Here is a tbx with those ideas, perhaps someone has some better ideas
(Ah… you have to replace the badge “review” with “stop” or you must create a user icon, that is called “review” with such a nice cup of coffee… I think, this is the icon for the review in OF… the built in icons have a bit low resolution)
Slightly related, so I’ll take a chance on posting it in this thread . . .
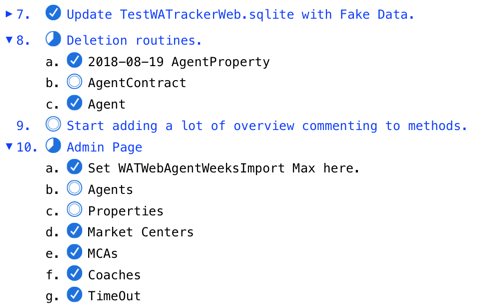
I’d love to something similar in Outline View, where Containers have badges that show the relative completion status of their children. I was used to this in Curio, where it could show something like this:
I think I may have to just copy a collection of images like those on the left of each text string above, to the Badges folder, and then use an Agent that picks the correct one as a Badge for this or that Note.
You could try Outline colour swatches. Note these don’t support plot-type patterns but you can use bar() and vbar() patterns to show progress.
Apart from the fact that you need a badge for each state, I think your idea of using custom badges is probably better than swatches, but I mention them as they might otherwise be overlooked. Note too that these swatches only show in Outline view - so that might also be a factor in your choice.
On the left, the section named “Prospective” is dedicated to the projects I can’t work with yet currently. On the right, it is a kind of calendar view. The “Inbox” is for some ideas on the fly.
For my daily tasks, I used Omnifocus on my phone, but I don’t use anymore any mobile application. Instead of it, I write down my notes on sheets of paper. But it’s precisely the reason why I needed a file: not only to gather my ideas, but to have of them an overview and to process them too. For instance, if one can take some notes into Omnifocus, OF is not designed to let you draw a diagram with plenty of arrows and full of notes and external links.
As you can see on the screenshots above, it is exactly what I was looking for: designing a project in the very place you write it too: New dashboard.tbx (95.9 KB)
…which avoids the need to count the list size returned by collect(). Both work equally well - I’m not suggesting there is a single ‘right’ way to do this.
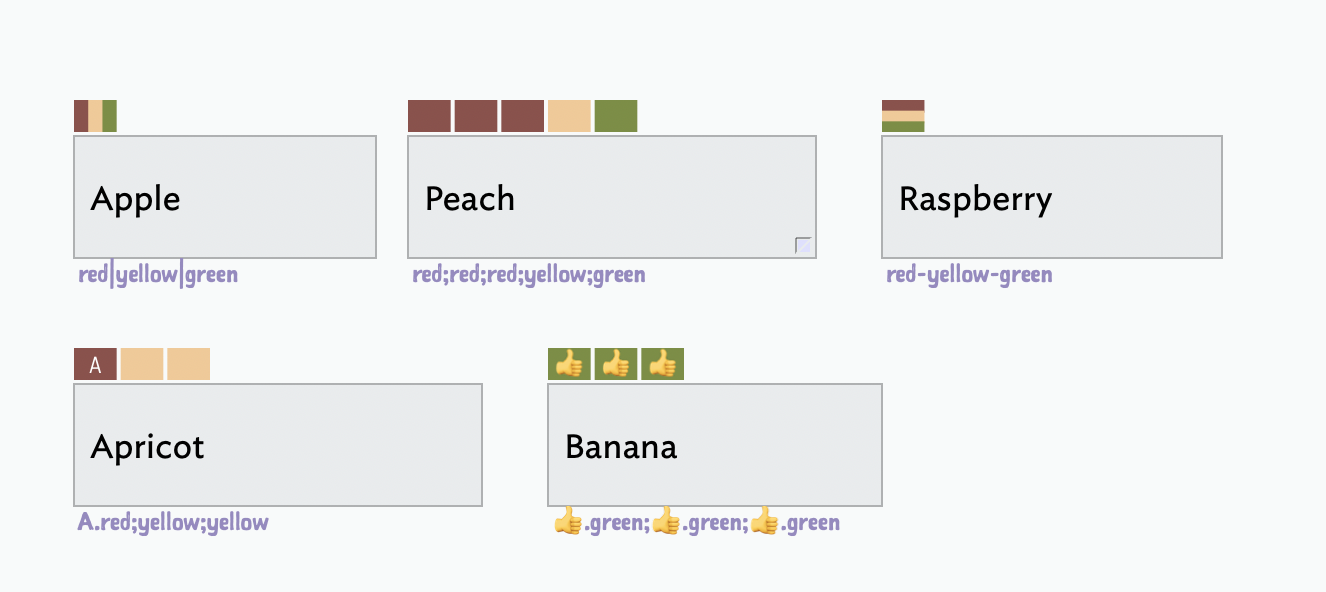
Another beautiful but perhaps underused feature is Note Flags. Available on Maps, they are a graphical interpretation of a list of text in the built-in $Flags attribute.
A nearly infinite variety of visual coding schemes are possible. And a note can have multiple flags, each with a different bit of information encoded within.
I created a demo of a TBX file that shows using Badges to show progress, in increments of 1/8 (12.5%) in Outline View. The calculations take into account the use of Separators, which end up as children without checkboxes. This zip file includes the TBX file and the needed Badges.TaskProgress.zip (37.9 KB)
Very cool! Perhaps this would be a good idea for @eastgate to hard code something like this into TB? At least for the outline view…
The ideas behind this are:
First you cannot use any other badge any more
And second: the rule is really taking up some space and the whole process seems a bit cumbersome, especially if you set up those rules for every container (even if you use a prototype)