A new opportunity for cross-tabulations within Tinderbox

Hey, another person in the space industry using Tinderbox! That’s out of this world.

Admitting that I haven’t read every post above in detail, I’ll quickly add my 2 cents.

Warning! High School math ahead!

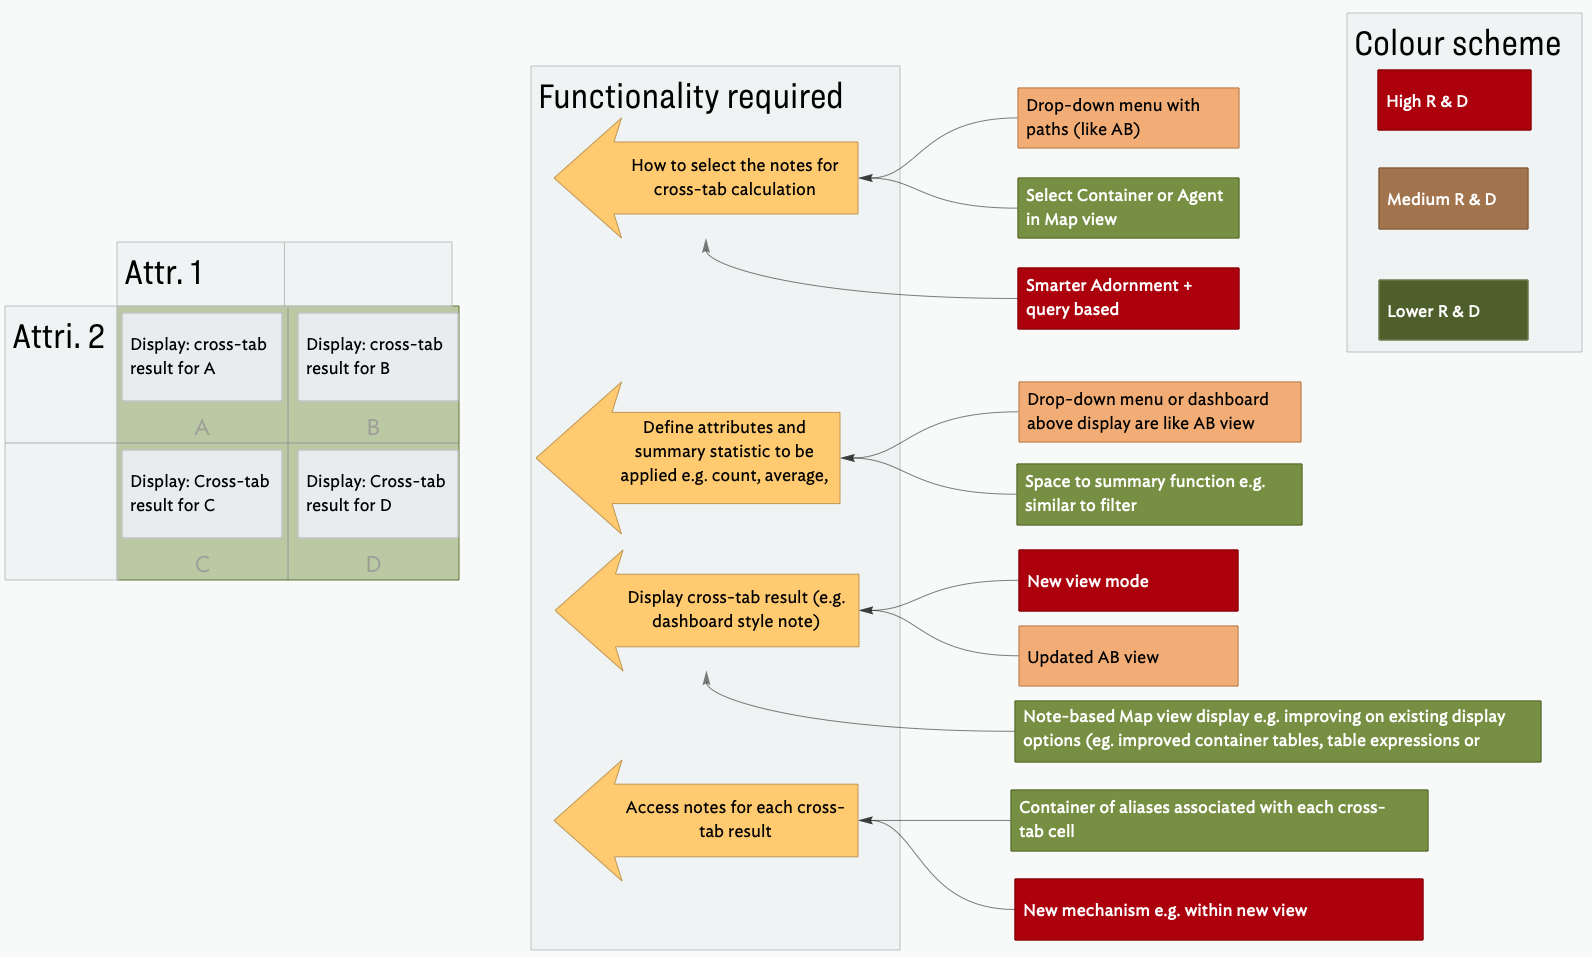
When modeling two sets of objects which share an intersecting subset I’ve also reached for adornments with the $Query attribute set and been disappointed that the adornments don’t figure out that a note matching both should be in the overlap of the two adornments. I understand why they don’t yet — this isn’t a trivial problem to solve — but composing adornments did seem like a natural solution at the time.

If I were to implement something like this my approach would be:

  1. Find all of the adornments whose $Query set contains the note in question.
  2. Extract the x_top_r, y_top_r, x_bottom_l, y_bottom_l coordinates for each adornment’s bounding box. (I’m going to assume that notes have a single point coordinate which determines their location, but the below should generalize to rectangular shapes pretty easily.)
  3. Construct a system of linear constraints (pseudocode):
for x_tr, y_tr, x_bl, y_bl in adornment_bbs:
    constrain(x_note <= x_tr)
    constrain(x_note <= y_tr)
    constrain(x_bl <= x_note)
    constrain(y_bl <= x_note)
  1. Solve the system of linear constraints, yielding a bound on the values of x and y which the note can take. Assign the note a set of coordinates freely within the box. If there are other notes in the intersection and you want to avoid covering them entirely, add additional constraints to the system above.

This is a very fast problem to solve using Gaussian elimination. If you want, you can also go the more complex route and add a linear objective function which determines the “best” point to put the note at and solve it with the Simplex algorithm, although I would imagine the constraint systems that Tinderbox would be solving are small and could also be easily optimized with a simple search over the solutions to the linear equations.

Whew! That wasn’t too hard. Looking forward to a constraint-based Tinderbox layout engine, @eastgate! :wink:

Not meaning to be a Luddite – but isn’t it simpler just to use software that was built for cross-tabs?

2 Likes

Interesting factoid: Chris Van Wyk, who pioneered a lot of constraint-based interface stuff when he was working with Knuth, had the room next to mine when we were Swarthmore freshmen.

2 Likes

My thought, since I started reading this thread…
What about R Studio for example? Perhaps TB is not the right (or let’s better say: not the best) tool for this job.

Nevertheless, this thread has a lot of useful and interesting ideas!

2 Likes

Useful to look at the advantages of cross-tabulation within TB

  • Additional and actionable insight into the content and relationships between notes directly within TB.
  • Access between notes and cross-tab is maintained ie. possible to directly scan through the notes contributing to the cross-tab results and interact with them e.g. link them to other concepts, place of top of adornments and so on. This is one of the advantages of the existing AB mode which provides both summarising/grouping capability as well as access to the notes and which a cross-tab in TB should keep. In my cross-tab mock-up I can access all the underlying notes contributing to the results and trends.

Exporting data to outside tools that support cross-tabulation (statistical software such as R, Excel etc…) would not allow for the above and it laborious to repeat for every new question.

And I thought I was the only “space” person in the TB world :slightly_smiling_face:

You’ve provided a concise summary of how to optimise layout for notes and welcome support to the idea of using Adornment overlap in a consistent and expressive way (re. in terms of information and interpretation).

What is required now from my perspective is some testing with mockups (say drawing overlapping Adornments with manually placed variable number of notes) to demonstrate the idea and the challenges. I haven’t done it yet but I agree with @eastgate that many notes and limited overlap area will be a challenge.

I was wondering if for a large number of notes the membership of an Adornment or overlapping Adornments could be implemented using links between the Adornment and the notes matching the query. It could be a step towards “clustering” of note (visually and conceptually).

1 Like

I like the thought of cross tabulation but, IMO it makes more sense in a separate view akin to AB view. In no small part this is due to the fact that the map based approach scales poorly as reflected at the tail of the post above. With 10-20 notes in the grid it gets cluttered (especially if the notes are big enough to read meaningful $Name values) Get to 00s or 000s of notes as in a mature working file and I don’t see how the visual approach works.

Thus, if creating a cross-tab function, ISTM that this is better done in a separate view but with a means to ‘read’ data back to a map. Making the cross-tab values (counts of times or of a given attribute) available to action code means there is scope to use this back in others view (e.g. map) as well as for export.

I know the idea feels right from a visual thinking perspective but my long-term experience of map use is for all bar smaller maps you run out of space. Either everything’s too small to read (icon size and/or zoom level) or there is insufficient screen space to see enough of the map (physical screen size/zoom level). IOW, unless there is a display method that can usefully show more than a few notes the overlapped smart adornment approach seem to be over optimistic as an approach. In our mind’s eye we tend to elide these visual issue of scale; what seems appealing in thought can be less so in a live view.

If things did go down an adornment route, I’d suggest a single gridded adornment (configured via properties pop-over) rather then manually placed overlaps as the latter gets tiresome to construct for more than a few rows/columns.

A further thought or two on the intersecting-smart-adornment approach:

  1. In principle, the set of constraints doesn’t seem onerous, though I’m worried that in practice the intersections are going to be too small to contain the notes they need.

  2. If some notes are large, they might extend from the intended adornment into other adornments where they are not wanted, triggering the wrong OnAdd and OnRemove actions.

  3. Of course, all these issues are under the user’s control. And they’re all readily visible; if your notes are too big, make them smaller!

  4. If we have N adornments in a map, I believe we might have N!/2 intersections to consider. 15 is not a priori an unreasonable number of adornments; 15! is 1e12. I’m pretty sure we can be more clever about this, and we already have quadtrees under the hood; still, this could get nasty in a hurry.

  5. For many analytical tasks, it’s OK to think about timescales of milliseconds or even seconds. A big attribute browser view that classifies a few thousand notes takes a second: that’s not ideal but it’s fine. But the timescale for some map tasks is much shorter; anything that needs to be done during a drag must be done in a millisecond — certainly in less than 10ms.

  6. A deeper issue is that, in Tinderbox, items have a place on the map. This note is here and not there, just as it is big and green, and not small and black. I expect that the objects we’re crosstabing will often need to be aliases of notes that reside somewhere else; that’s a further complication.

  7. I acknowledge that some people dislike the idea that notes have a place and identity, and would prefer a different dispensation.

  8. There’s a separate, but related. request for better coverage of co-occurence, and this might conceivably use the same new view.

  9. New views have significant engineering overhead, but it’s not intolerable. They do have a lot of variance; some new views work quite nicely, others have been less satisfactory. It can be better to isolate experiments.

1 Like

All good points. I suggest to focus on the functionality that is required regardless of implementation in TB. This should include (as per other posts here):

  • The selection of notes to be analysed using cross-tabulation
  • The selection of at least 2 note attributes and their ranges
  • To define what information is required in the cross-tab (e.g. count, average, max, min, most frequent, number of unique notes etc…)
  • To display the cross-tab results
  • To provide the TB user with access to the notes and their contents selected for each cross-tabulation result (e.g. table cell)

I’ve visualised this within TB and then link the function to some options that we proposed for each of these steps. In addition I’ve tried to estimate the R & D footprint for such implementation work and colour coded the options accordingly (with many many caveats as I don’t know the details. In general the close to existing functionality the lower the R & D). The result is provided below:

On the left is a minimalist cross-tab for 2 attributes each attribute with two options (e.g. like a boolean). Further to the right the functionality and then implementation options.

I’ve come to the conclusion that the most efficient implementation could be via the idea of a Super Container or a container of containers which builds on many of the expressive idioms already available in TB. This is illustrated below:

The super container has access to all the notes for the cross-tab analyses and has an updated display option in the note that supports cross-tables. Each cell in the cross-table is a container of it’s own with alias to all contributing notes and displays the cross-tab cell summary based on the user function selected.

The advantage of this approach is that - apart from the details of selecting attributes and the new table functionality and its display - existing TB tools and idioms can be used. It is essentially a TableView summary (improved) which summarises the contents of the notes rather than list them as currently the case.

All to be taken with a grain of salt of course. However I hope that by presenting an outline of an implementation I can give some impetus to zero in on possible implementation of this new functionality.

It will be necessary to use aliases in such a cross tab, unless List or Set type attributes are excluded. Multiple-value type attributes can match more than one cross tab cell, so would require at least one instance in the grid to be an alias. Rather than have a mix of aliases and originals it would make more sense to have all aliases.

If the grid is a container’s viewport, bear in mind that not all the visual affordances are drawn in the viewport.

Not mentioned in the last summary but as important, for analytical work, as other factors is being able to access the cross-tab data via action code, both for use elsewhere and for export. Having to manually copy data or set up a host of new queries just to re-tabulate the cross-tab grids output would be frustrating duplication of effort for the user.

Thanks for the reminder. Agreed action-code access to the cross-table is required. Do you have an idea of how to store the data (a new array attribute ?) and how the functions to access should look ? As a starting point the ability to copy all cells in the cross-tab would be a minimum.

My thought here are driven by the difficulties in tabulating my PhD research work, done in Tinderbox. The app was excellent is supporting emergent structure. Eventually I needed to tabulate the finding for use in the thesis. So here is a screen of AB view from one of the documents (investigating what Wikipedia ‘bot’ accounts really are and their actual roles):

This is how I use it. I’ll admit using columns puts added load on the app but it helps massively when checking for data errors omissions (I’d hide them, but they can’t be toggled in/out like Outline view; you have to delete them and I don’t want to mess with the file just for a picture. The overall scope, in terms of times, is c.1,100 items.

The problem is that so see every count, I have to scroll through 1,000+ rows. Tinderbox does have a form of array, albeit for a different purpose: look-up tables, i.e. lists of colon limited value pairs. They could as easily hold category:count value pairs. With such a pair list, existing tools can be used to re-display the data internally or export it for use in other tools. Counts are fine, as numerical but if the values were strings there is the edge case of string values holding colons or semi-colons as those have structural meaning in the stored list and need to be escaped somehow (no built-in escaping mechanism for this exists AFAIK).

The columns (above) in AB view, in my minds, could instead be additional cross-tabs. At present AB view essentially offers a cross-tab for 1 column and N rows.

In truth, No. Tinderbox doesn’t have N-dimensional arrays (if that’s the right term). Bear in mind that in the app’s 20 years [sic] of life, most of the emphasis has been on discovering relationships between textual object, the map view especially providing a very visual means to do this. Columns in Outline view date to v5.0 in Dec 2009 but it wasn’t until v6.0 in May 2014 that AB view turned up. Look-up tables were added in v6.3 in June 2016. Over the apps life action code has grown from a simple macro system mainly to support export (you see early versions, use to mid 200 here). If this seems tangential it is to make the point that, as confuses some users with a programming background, action code is not an internal programming system designed as such but a much evolved internal macro system.

AB view takes an (optionally agent-scoped) set of items—the rows—and for a given attribute, categorises the rows by the attribute’s value. In cross-tab terms the column could be though of as a query for items having a value for that attribute (although AB view includes a ‘no value’ category).

I reference AB view functions less for the visual element than for the fact it is the closest Tinderbox has to a cross-tab system.

This begs the question as to what you would get. In each ‘cell’ I imaging a count would be shown. The cell data is of little meaning without knowing the two intersecting queries. So the information in the cell, might be any all of:

  • Row query
  • Column query
  • Cell population count
  • Titles (paths?) of matching items. Original path or alias?

It might be that separate action operators retrieve different ‘parts’ of the above, e.g. just the count matrix, though in what form. It might be the data is all accessed by an operator in a form suitable for export use (HTML, perhaps tables in text export). I don’t know.

Sorry for the long post, but I thought some background might help, in terms of sort of things we can do now.

1 Like

@mwra thanks for you in-depth posts and history, as always. I think they help frame the context but also provide a real-world rationale for using the AB as the basis for cross-tabulation in Tinderbox. Either using AB itself, with modifications as suggested in this thread, or as a starting point for building a new view.

Using a map for cross-tab is to my mind like, for every project, having to first build Excel from scratch and then use it. Map adornments can be make to look like a table, but that doesn’t me they should become tables.

3 Likes

Bouncing in for another quick reply regarding intersections of smart adornments:

That’s true, but you don’t need to check every intersection if all you want to do is move notes. Presumably you already know which adornments the note matches — after all, we have functionality for pulling notes onto a single adornment already — so all that’s needed is to figure out if there is a region in the map which satisfies all of those adornments at once. I would bet that the number of matches will be small in most cases, so the systems of equations defining the feasible regions will likely have less than a dozen or so constraints. Simplex is an exponential time algorithm, but the problems here are very small and will be fast to solve regardless.

You’ll need to handle a failure mode anyway where a note matches two adornments with no intersection, but that’s also already handled with the current adornment implementation.

(Not going to comment on the rest of the tabulation discussion here; my use case wasn’t that complex.)

Neat!

I discovered another building block addressing an implementation of cross-tabulation using an array of agents/queries embedded in a container display.

Starting with TB v8 Agents and Queries can be created using action code. For instance the following creates an Agent urgent tasks and gives it a query.

createAgent(/agents/urgentTasks); $AgentQuery(/agents/urgentTasks)=“$MyBoolean==true”;

I’m not sure whether there is a way of iterating over all the unique values of two attributes and generating each combination of attribute values to generate the full array of agents. I sense that action code such as set each might help here to set up a rudimentary cross-tab capability.

Building further on the ideas of an 2D array of Agent-like queries to generate a cross-tab (see for instance the original discussion as well as a more concrete implementation proposal above), some limited automation is already possible using Action code. Consider the following Map view below

image

All the notes are located in the container /Notes. Each note has two key attributes defined $MyNumber and $MyString. The numbers range from 1 to 2 and there are two different types of Strings so a 2 x 2 cross-tab is sufficient to summarise all combinations.

The 2D array of Agents on the right was generated using the following Action code implemented as a stamp. Note the two-level iteration required to collect all possible combinations and the use of the CreateAgent action code.

$MyAttribute1=collect(children(/Notes),$MyNumber).unique;
$MyAttribute2=collect(children(/Notes),$MyString).unique;
$MyString=;
$MyAttribute1.each(x){ $MyAttribute2.each(y){$MyString=$MyString +“$MyNumber==”+x+" & “+”$MyString==“+y+”\n" ; }} ;
$MyList=$MyString.split(“\n”);
$MyList.each(x){createAgent(“/”,“Q”+x);$AgentQuery(“/”+“Q”+x)=x+“&” + “descendedFrom(/Notes)”;}

It is still rather a kludge and requires further manual intervention to be useful. For instance the created Agents need to be arranged in a 2D array, the $DisplayExpression needs to be edited to generate the required summary statistic e.g. count or similar and the Agents need to be styled so as to display the value for each cell. However it provides a starting point for larger cross-tabs (say 10 x 10) automating the first step.

Real cross-tab functionality will require a more dedicated solution within TB… that’s clear.