I have a database of records that are a bit different from grade items.
My last test contained 97 multiple choice items labeled Item001, …, Item100 (I eliminated 3 items.)
Each item is categories by the course learning outcomes CLO01, CLO02, …,
CLO08.
There are 22 students who took the test, labeled SS001, SS002, …, SS022.
For my department report, I need to find scores by CLO for each student.
I cannot figure out how to create agents to do this. I have created a folder for SS001, but I would have to do this 172 times for the whole class. Is there an easier way to do this?
I have no solution but can perhaps take the discussion one step further for other more capable users take up the challenge. One of the challenges is the structure of your data. If I’ve understood correctly:
$Name represents each student e.g. SS001 is student 001
Each $Item_ID which is a multiple choice item can be mapped into one or more CLOs
You want to calculate the total of scores for each CLO and each student (22 students x 8 CLOs = 176) ?
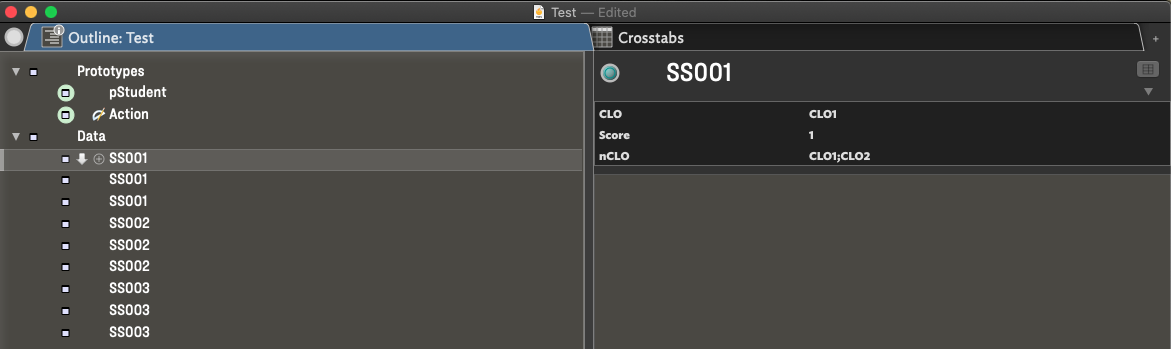
I was thinking initially that this might be a good case for the cross-tabs display option as this allows the binning of notes as a function of two attributes. In your case however the CLO1 are each distinct attributes e.g. CLO_1, CLO_2 and cannot be used for this purpose. Depending on your spreadsheet and TB skills you might consider remapping the attributes creating an attribute $CLO which is a Set. For my own education I’ve done this for a small test case and applied the cross-tab view to illustrate as per below.
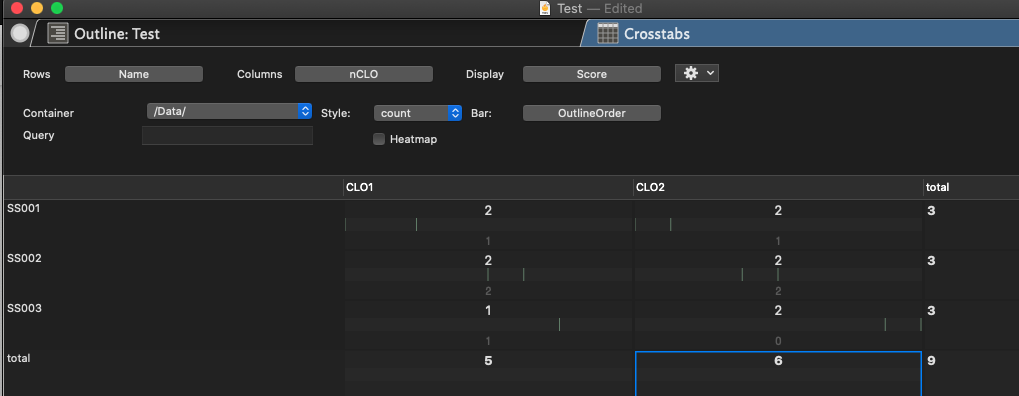
Applying the cross-tab view and setting the row attribute to the student name $Name, columns to a new Set attribute $nCLO, as display the $Score I get a little closer (also using the unlimited bins option)
Unfortunately TB does not include additional statistics other than count and percentage (e.g. there is no option to my knowledge to sum or average the scores and display these). What you can do is right click on each sell and have TB generate the agent for you. You can also easily explore the notes in each bin if they contain additional information about the students performance. Lastly, I’ve not tried it out but you can also perform an action on the contents of each cell. I haven’t seen much documentation on this feature so cannot comment whether for instance the Stamp would have access to the row and column settings which would allow you to store the outcome of the calculation in a single reference note for each student.
Below the test TB document as a reference. Test.tbx (72.9 KB)
My apologies, when cleaning the data I deleted two students. Test items, 15, 89, and 97 are missing because they were duplicates on the test.
I have now double checked the data and it seems to be correct i.e. 22 students with 97 test item scores. I am reattaching the corrected file.
This is as follow up to the Grade videos last year by Michael.
I have a database of records that are a bit different from grade items.
My last test contained 97 multiple choice items labeled Item001, …, Item100 (I eliminated 3 items.)
Each item is categories by the course learning outcomes CLO01, CLO02, …,
CLO08.
There are 22 students who took the test, labeled SS001, SS002, …, SS022.
For my department report, I need to find scores by CLO for each student.
I cannot figure out how to create agents to do this. I have created a folder for SS001, but I would have to do this 172 times for the whole class. Is there an easier way to do this? Mat443v.2.tbx (1.9 MB)
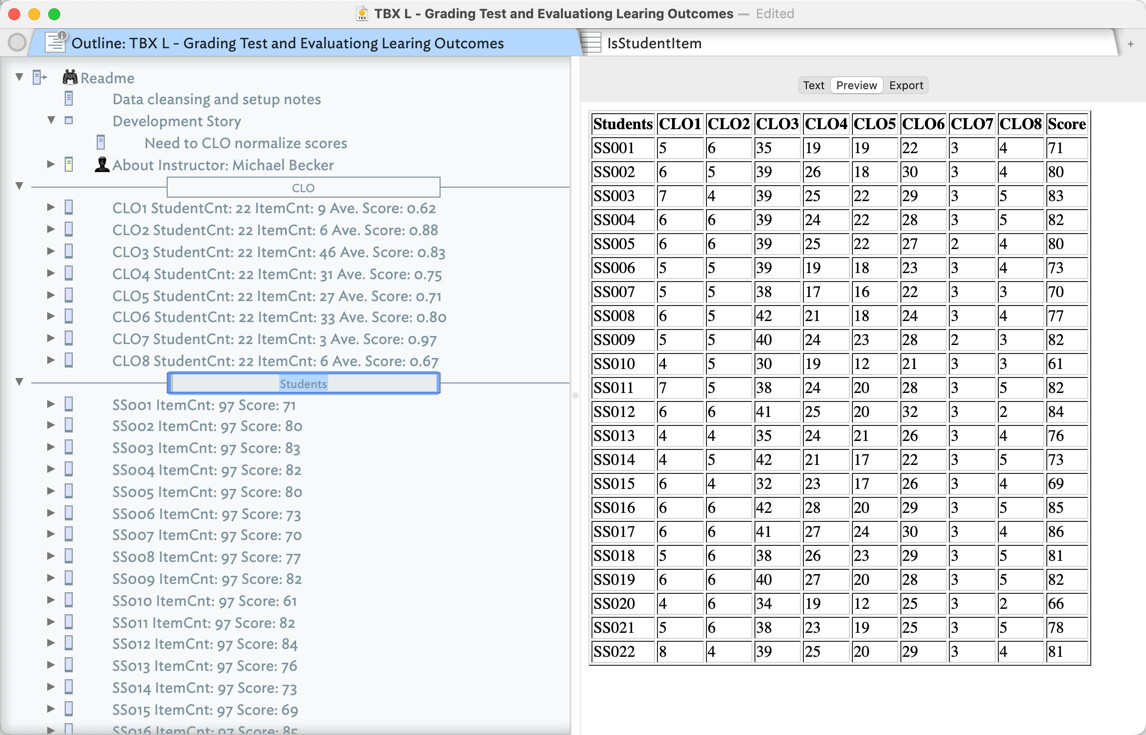
@jwilkins try this. There is probably a more efficient way to do this, but this ALMOST gets the job done.
I used agents to pull stats for CLO and Students. Built a table to report on the students. Note, that scoring on the CLO needs to be thought through. Many items have multiple LO, e.g. CLO3 applies to 42 items. We need to think through how to normalize the number, e.g., take into consideration the number of students that tested the item, the number of items that CLO is associated with, and the total potential score. I’ve tried this: ($Score/$Itemcnt)//$StudentCnt). If I am not mistaken this would be the normalized average result for each of the CLO. Would this be correct? I’m not sure.
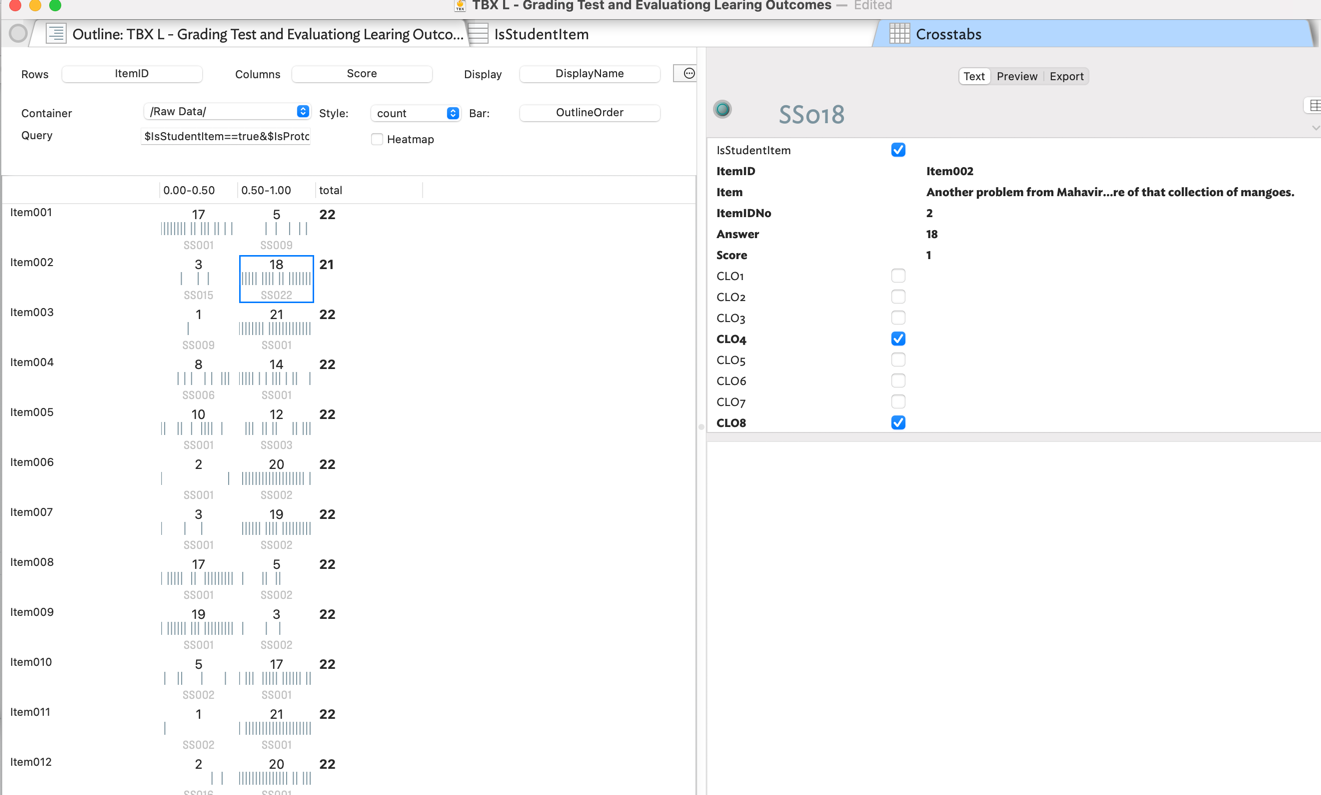
Also, if you use Cross tabs you can start ranking results by item. Note, this, as does Attribute Browser, also shows you that a student is missing for item #1.
@eastgate Is there a way to have crosstab bins not show a range? For instance, if we know the columns have discrete numbers, .e.g, 0 and 1, is there a way to label the bins 0 and 1 and not 0-.5 and .5-1? See above.
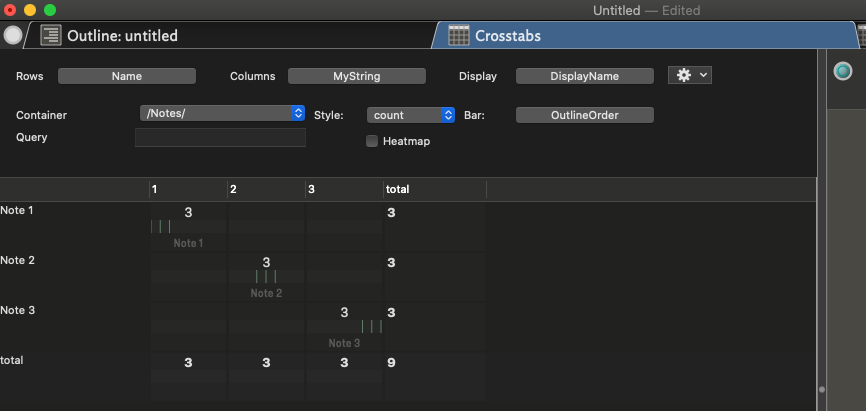
It depends on the type of attribute. Currently Tinderbox does not create bins for integer values of a number attribute in Cross Tabs. However, you can get the bins you are looking for by using string attributes instead of number. Consider for instance the following test case where ys use $MyString and $MyNumber to store the same integer digits with values ranging between 1 and 3.
Using $MyNumber and cross tabs I get the pesky floating point bin allocations, in this case they don’t make sense.