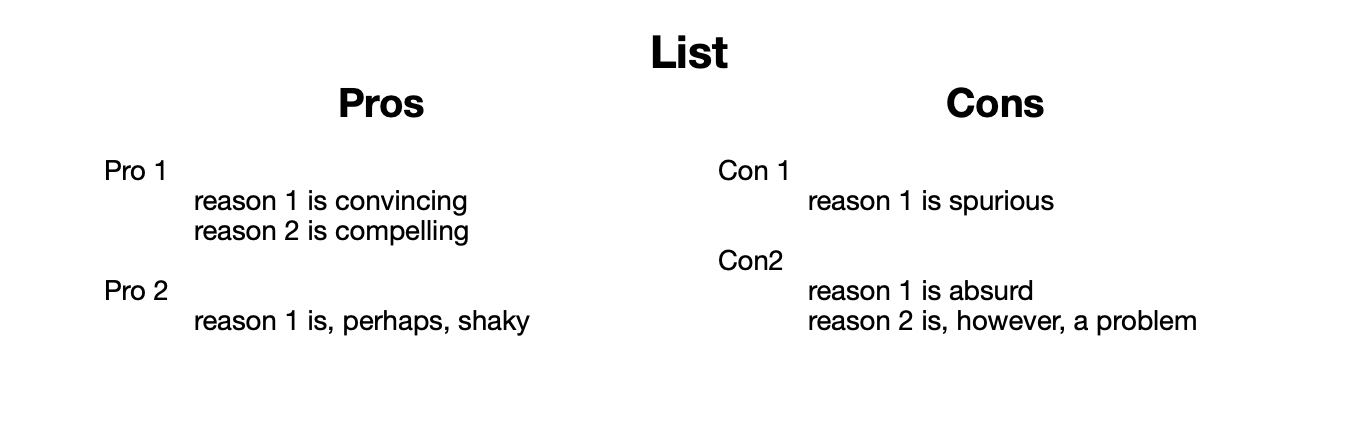
I am trying to create a Pros and Cons table with the help of notes and HTML. And will further be exporting it in the HTML format.
I am requesting clarity and guidance on the following topics : 1) The Export Preview is not as expected at all. How do i make it look like the expected image
Is defining columns correctly possible (i.e <<>>>) ?
Thanks for the test do, it’s helps immediately show the problem. Garbage in, garbage out—for tables you need to think how each note is exported or included. The preview of note 'list Just you use of inheritance
The error here is you’re not thinking through the export. The normal way to export a table from
Yes, if you create your outline and templates in a way that complement each other. You challenge were is you are thinking in grid/Excel terms. For Table export via an outline you have to think of rows as sibling items are on the same row, you can’y process by walking the tree, but need to use more deliberate includes or—ugh—nested tables. Actually using styled <div>s instead of tables would make more sense.
What does this mean in HTML table terms? It’s a form of mark-up I’ve never seen for HTML.
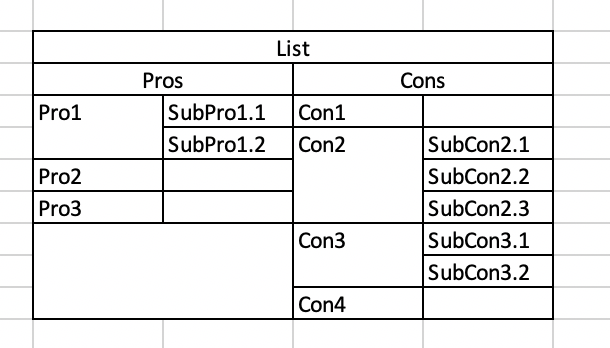
So, if we re-draw your table for sense and add an extra ‘con’ so we’ve different numbers of pro & con (for test/build purposes), it looks like this:
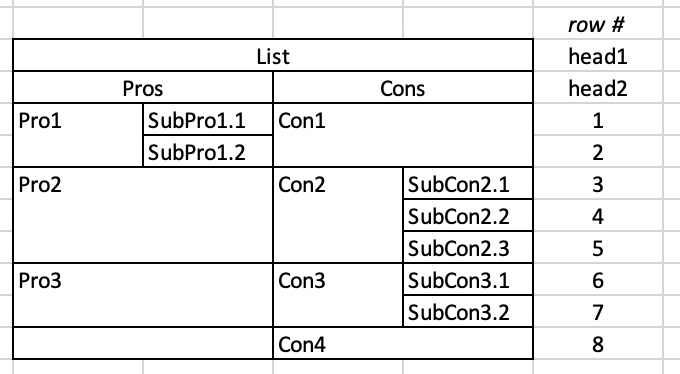
But, for HTML table design terms we see it like this:
You can’t change how HTML works or the overall method of export. But at this point the latter helps u understand the HTML structure. Indeed it can help to actually make the HTML and then figure out how to to work. Data for 'note ‘Pro2’ needs to write into a cell spanning 2 columns and 3 rows. You the user will have to figure that out - by calculation or my setting those items manually.
I’m thinking on that latter task, but there are some of the issue to mull on and my work-in-progress TBX: Table-export.tbx (137.5 KB)
Note I’ve added/used appropriate prototypes for templates (so thinks like quote-type substitution don’t occur.
As Mark Anderson has pointed out already, some of the puzzles here arise because HTML doesn’t expect tables like this. I’m sure we can coax HTML to do what we want!
But perhaps we don’t need to. Let’s step back: what is the purpose or goal here? Are you informing yourself, or preparing a one-time management report, or preparing this for publication? Is it a one-time thing, or will you be doing these every day?
Because colspans/rowspans all arbitrary and HTML written row by row, this is a much more complex than imagined. I’ve run out of free time to complete the above. I’m now unconvinced it is worth the bother. This won’t work but the template code shows the sort of hoops we have to jump through:
OK, I’m confused. Isn’t that exactly way I listed at the end of my last post? I know how to write HTNML table—been doing it since they arrived in the 1990s. The code is easy. _Making the code via outline export is hard. The point is that at time of export Pro1 doesn’t know how many children Con1 has and vice versa. You can nest cells without nested tables.
I recall this is why same folk dumped tables for grids of disks once CSS and browsers improved.
But, apart from a completely wasted afternoon, I wonder what we are actually usefully achieving here? My hunch is that if we want tabular export we won’t store our data in this sort of outline as the two don’t (easily) map.
I create the html before you posted your answer - so sorry if I missed the point.
There is one difference in your structure compared to my quick sample: you use rowspan and colspan for the data part - I avoided the colspans there. This is easier to generate IMHO.
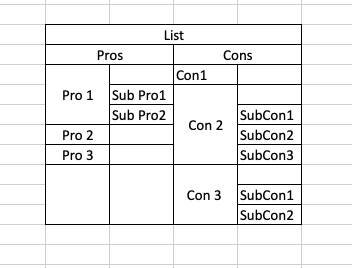
Since there seems to be no direct relation between the pros and the cons I would count the number of childs for pros and cons - the larger value will give me the number of rows. Then I would iterate through the child-notes and calculate the rowspan depending on the number of children… something like that would give me a table like this…
I’m also reflecting on the way this is done so easily at source in Excel where you ‘just’ merge some, … no w wait, what? That’s not right. I’ll just… [Microsoft Office demands to do massive update NOW: Yes | Yes] So, it’s actually really easy to do in Excel too.
But, why faff around with tables? The image below bit feint, but here’s a treemap view of the doc with ‘List’ as the root of the view.
OK, the lines are faint be we can colour that. We can even play with the box sizes. Here each parent is dived into N equally sized children. But we could equally use a calculated value (weighting!) via a Treemap Expression. This immediately sounds way more useful that the sterility of a table.
Or, build the layout on a map perhaps with some adornments to help.
OK, neither of the latter export to HTML. But, it’s 2021, and in either case we can take a view image (vector data!) and place what in a web page. Retained in vector from (.e.g. SVG) we can project that image scaled onto the side of a house/bus/moon.
Checks: seems we can’t get an image of a treemap or hyperbolic view (as opposed to a map/outline/chart/timeline). Odd. Anyway, I’ve reported it as a bug/feature request.
Wowww !!! This really opened a Pandora’s box for me.
Thank you sooo much for guiding me to a million ways.
To be honest, I have just started learning these wonders of Tinderbox 2 days ago, And as any noob player does I decided to look at tutorials and got stuck on a (still my highest level). Hence posted this to the forum asking for help (need to learn EVERYTHING!!)
I should’ve given more information, my apologies - The test was to run mind-maps. Data made here will be used and shared as documents.
Again I apologise (I promise to learn more ) My data will be stored in outline, exported as HTML and shared SIMPLE!!
Regardless, Thank you soo much for all the responses, and I shall study it all !!

 My hunch is that if we want tabular export we won’t store our data in this sort of outline as the two don’t (easily) map.