Sorry for the unclear heading but the problem I have is the following.
I am trying to analyze a set of academic journal articles, for each of which I have created a note. These notes contain basic data such as author, title, date etc, but I am also putting information in attributes such as $Topic, $Country, $MethodUsed. I am sure I have seen discussions of how to get TB to produce tables analysing this data (when I have entered it all). For example, a table with a column for each topic, and a row for each year, with counts in the cells.
If the answer is in TBRef or someonere else, a quick pointer would, hopefully, be enough. Or did I see something in one of the tutorials?
If I’ve understood correctly your table rows and columns headings are the values of the attributes, say $Topic and $year. One approach that comes integrated with TB makes use of the cross-tab view. Look it up here.
You can also search for cross-tabs in the discussions in this forum.
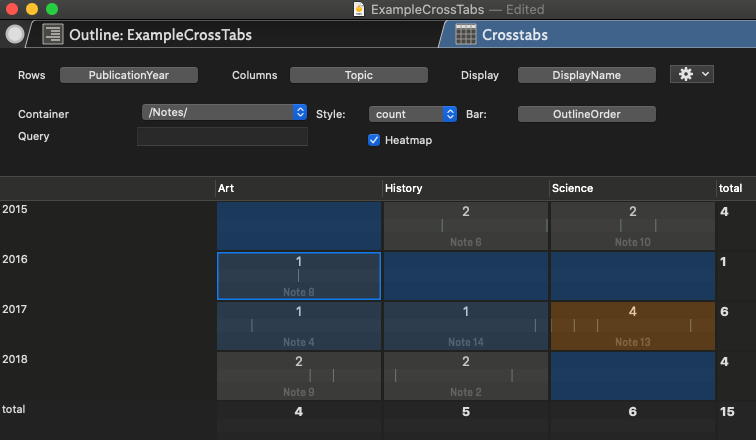
Ok - here is a contrived example. I’ve created 15 notes with Displayed Attributes $Topic and $PublicationYear. The values for $Topic are randomly chosen among 3 values (“Art”,“Science”,“History”) and those for $PublicationYear between 2015 and 2018.
I then select the Crosstab view with the following settings:
restrict the selection of notes to those within the container “/Notes”.
row headings come from the values of $PublicationYear
column headings come from the values of $Topic
tick the heatmap for a bit of colour and ensure each cell displayed the count e.g. number of notes with a given value for $PublicationYear and $Topic.
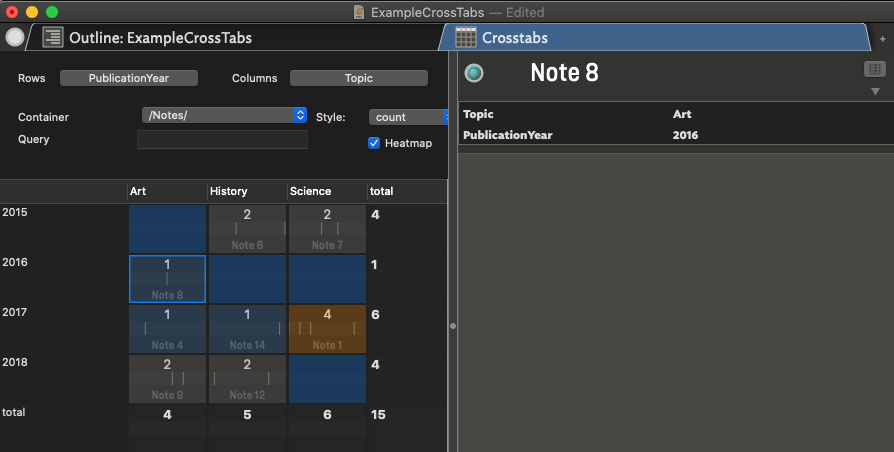
Note that each slender bar in the display is a note. You can click on it and edit the note directly as needed. For instance if I click on the bar Note 8 I get the following
Thank you very much indeed. It does just what I want, though I have the problem that instead of one row for each year, I get 5 categories, such as 1976.00-1977.60, 1977.60-1979-30, etc. The categories are not even the same size.
Agreed - the way TinderBox calculates the bins esp. for dates and integer values is not optimal. Here a post some time ago on the issue in this forum. I’m hoping this part of Crosstabs can be improved in future updates.
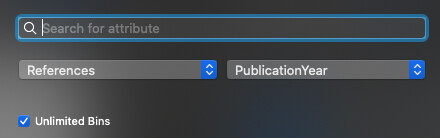
In the meantime have you tried setting the number of bins for the column/rows ? Clicking on the Row or Column field you can set the number of bins to unlimited as below and play with the setting. @eastgate could have to comment on how the bins are calculated and why your bin sizes of years vary.
Thanks again. I hadn’t noticed the option to change the number of bins, though when I check unlimited for the dates, I get a single bin, and I had to change the number to exactly the right number (currently 8, until I enter more data). And unlike your bins, they are all of the form 1977.00-1978.00.
Maybe the issue is that I have many more notes in the container, to which I have not added all the wanted attributes, and I restricted coverage with a query.
Now my task is to enter more data, so that I get a more interesting table! That is the slow part.