There is no ‘correct’ way to do this as the method chosen from those above will depend on your existing knowledge and expertise. For a user who has not used posters or AI before, here is one possible solution using native Tinderbox methods. Again, this is but one of many possible solutions:
Here is the TBX used to make the above: Project-tracking.tbx (149.7 KB)
For my TBX, I added a value for $Status of “Pending” and made that the default value for notes using a “pProject” user prototype. The container holding the project sets that prototype for all new child notes. The values of ‘Demo/On Hold/Closed/Pending’ are also suggested values for $Status.
The point of the ‘Pending’ value is this reminds you this is a project note not yet configured ready to be given a defined status.
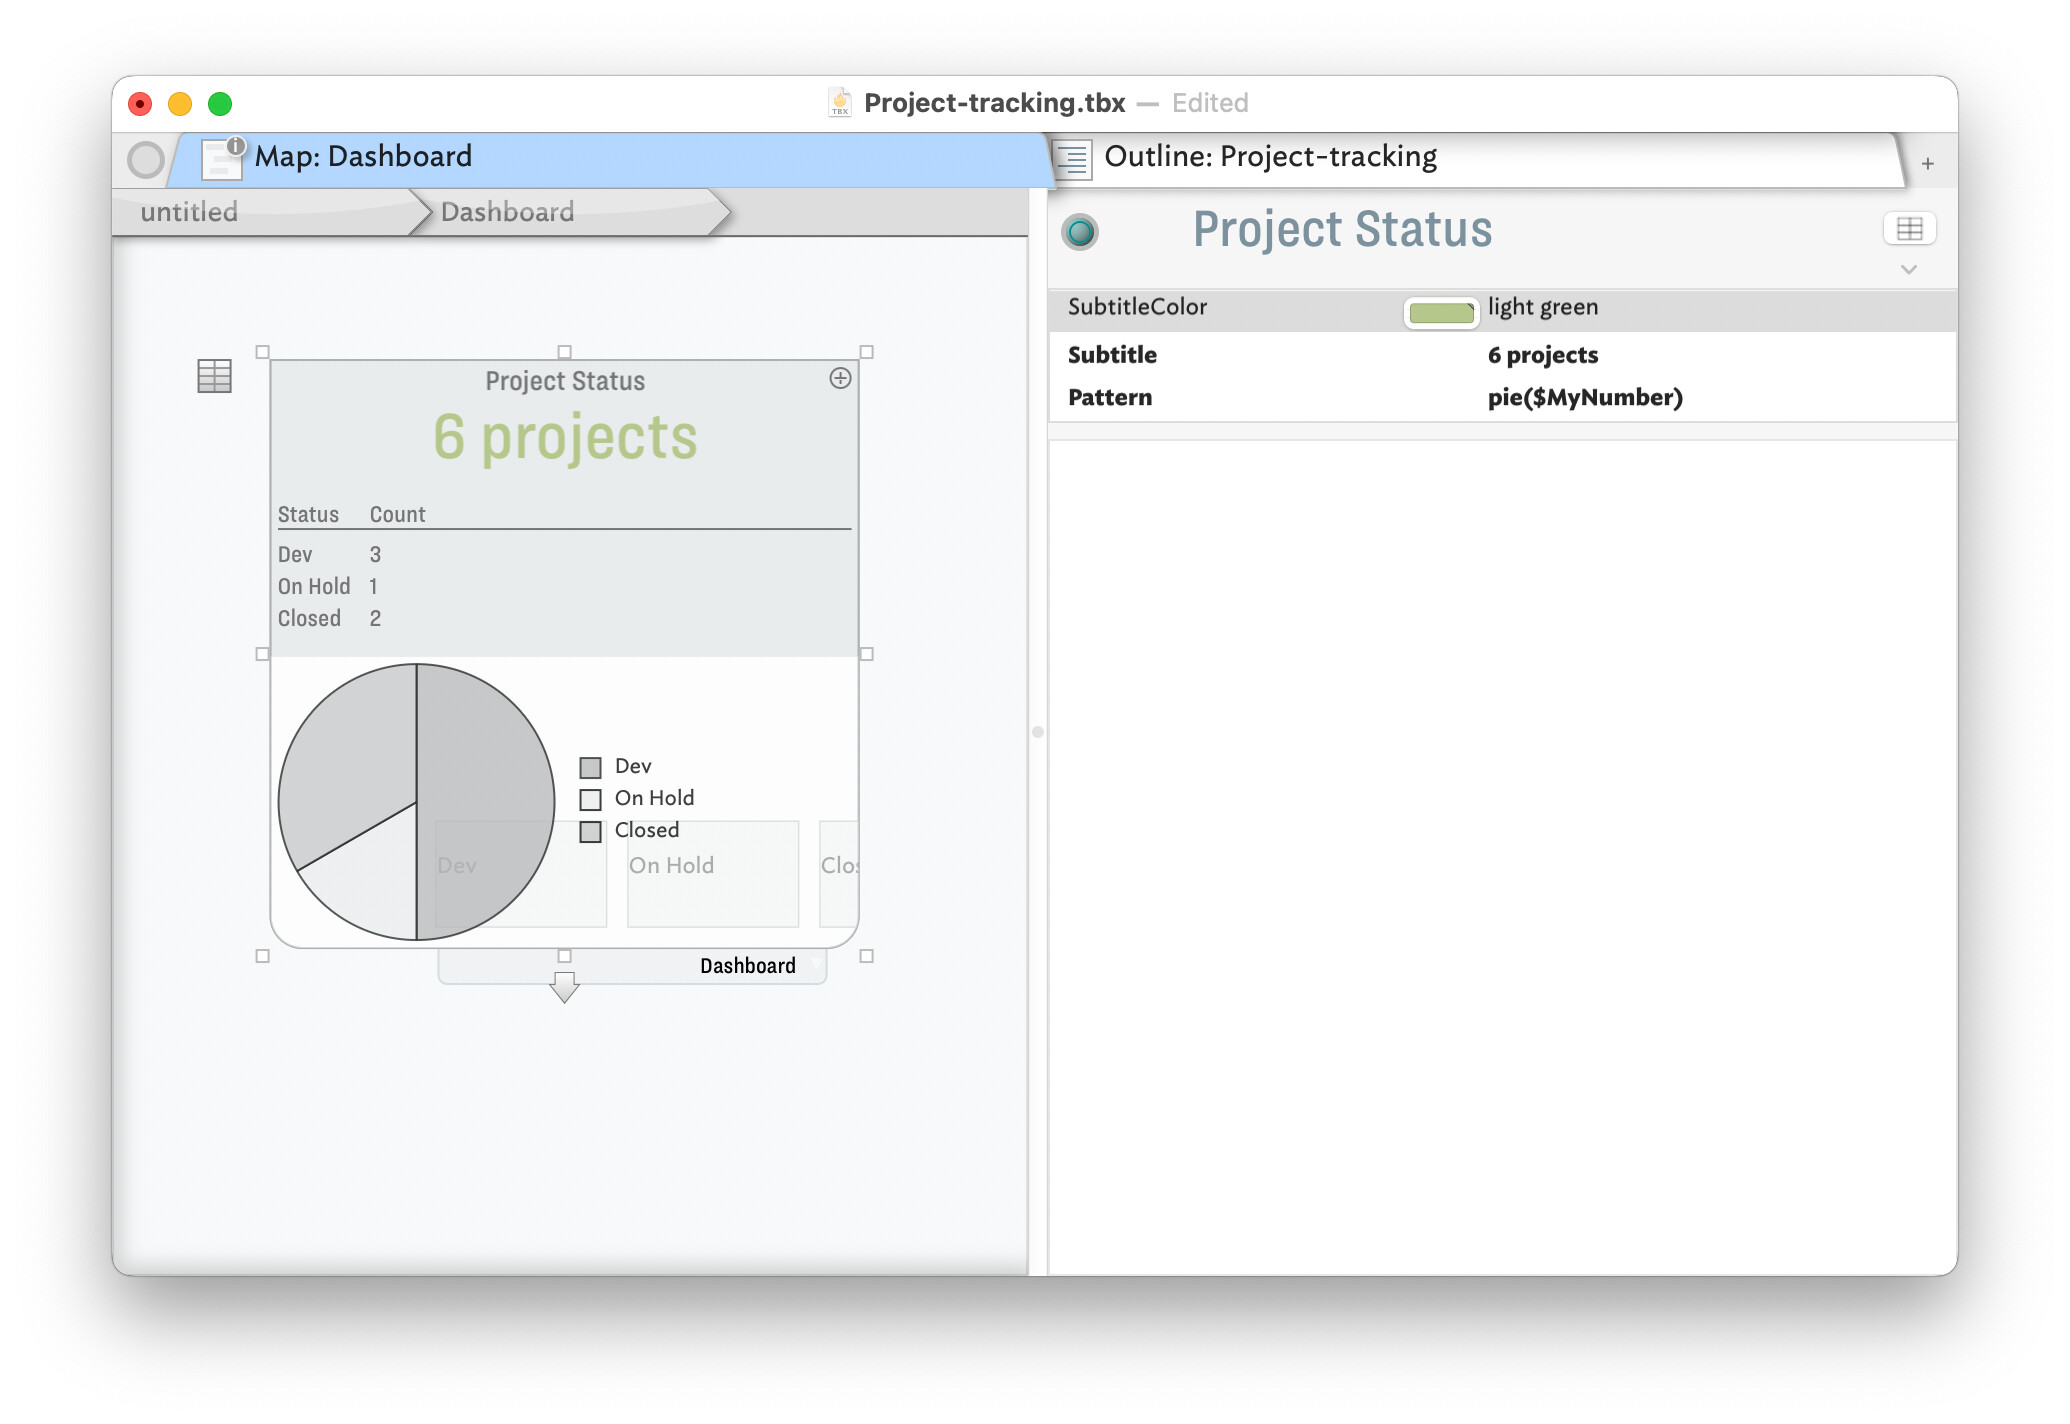
I have used/modified the built-in Dashboard prototype and applied to container ‘Project Status’. Avoiding cluttering the document with loads of alway-on agents, I added child 3 notes to the latter container, whose OnAdd applies a user prototype of ‘pStatus’. The Edict (that runs occasionally but also triggered by affecting events) has this code:
$MyNumber = sum_if(all,$Status==$Name(that),1);
Essentially it sets the note’s $MyNumber to the count of note whose $Status is the same as this note’s $Name.
In the ‘Project Status’ a table expression is used to summarise the value and this counts. The values are then plotted in the container viewport. I used a pie chart but you might prefer a bar chart: see more on container plots.
and all with zero use of AI! But, as noted upthread, AI is there as an approach for those who prefer that approach.