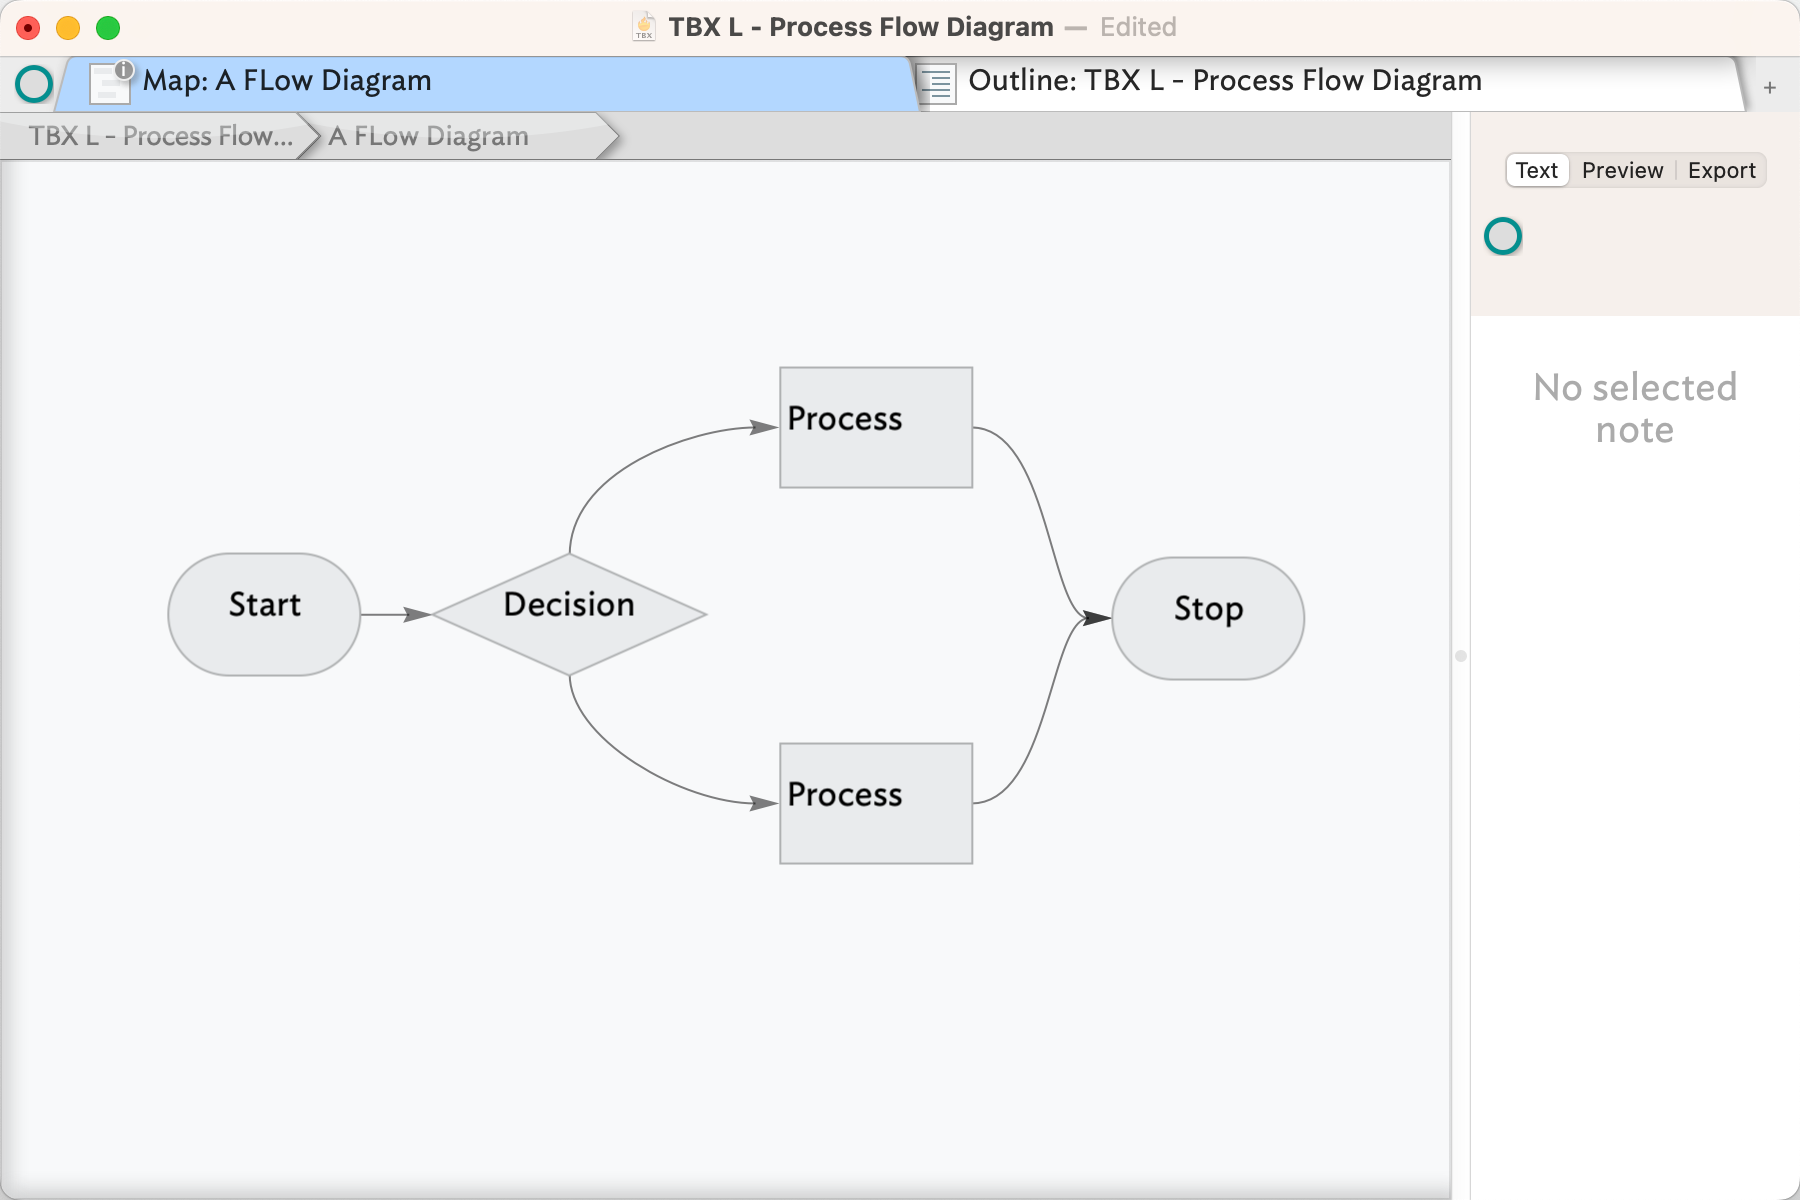
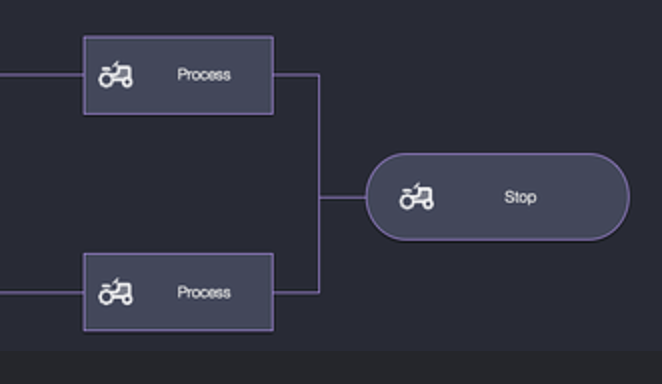
I’m trying to create some process flow diagrams in Tinderbox. I typically make these in Omnigraffle, but I thought I’d simplify my process by creating the visual and data layers in Tinderbox. However, I can’t find a way to add orthogonal connectors in Map view. I see they are available in the Chart view. However, the option to add shapes to a note in the Chart isn’t available. So, neither view gives me what I need. I wanted to double-check that I haven’t missed anything or if someone has a workaround to achieve a similar outcome. I’ve attached a simple example in a dark color scheme for reference.
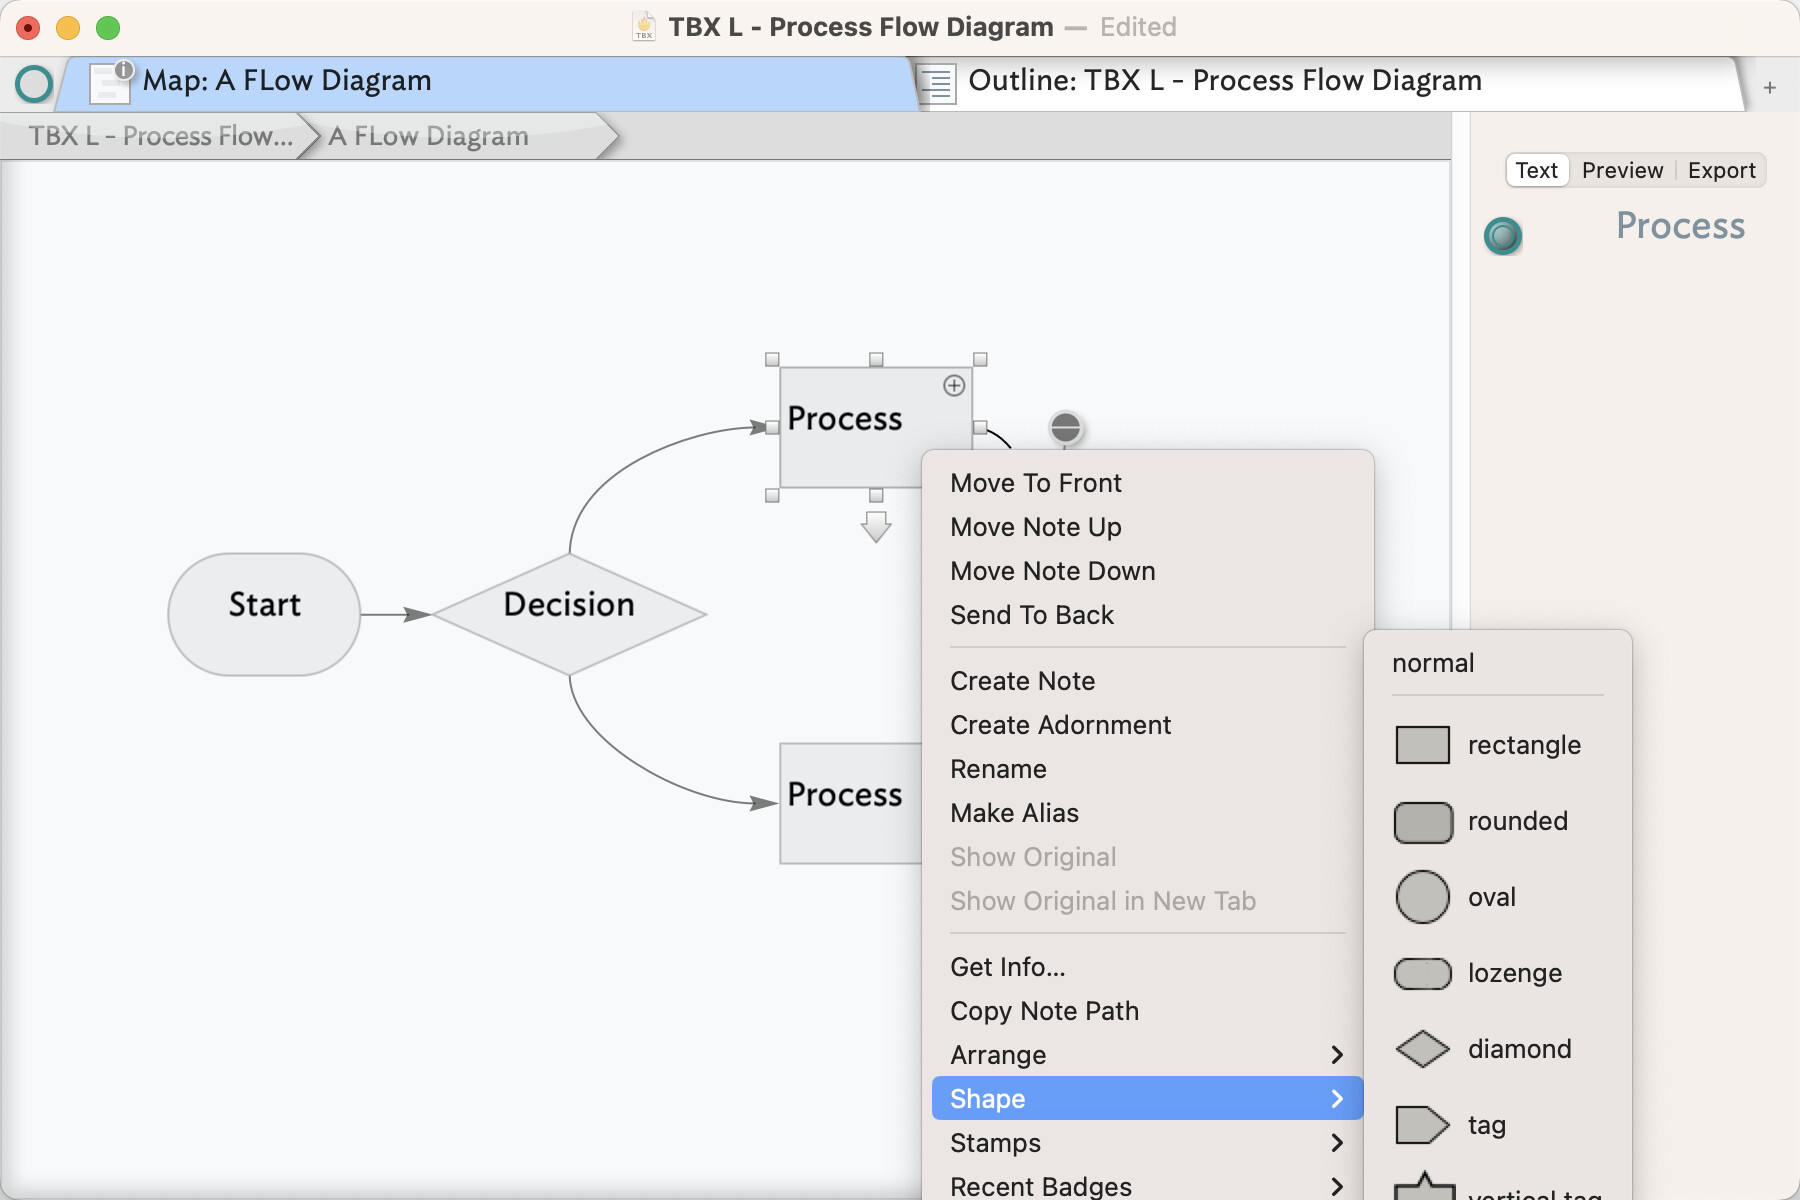
Thanks for the quick reply! I had created something similar in Map view but was specifically looking for orthogonal connectors (90 degrees). I found them in Chart view, but the shape selector was greyed out there. Hopefully, the attached images will add clarity.
We don’t do orthogonal connectors in maps, at present. Outbound links always exist from the top or bottom. Inbound links try to enter through the sides, but will choose the top or bottom in a pinch.
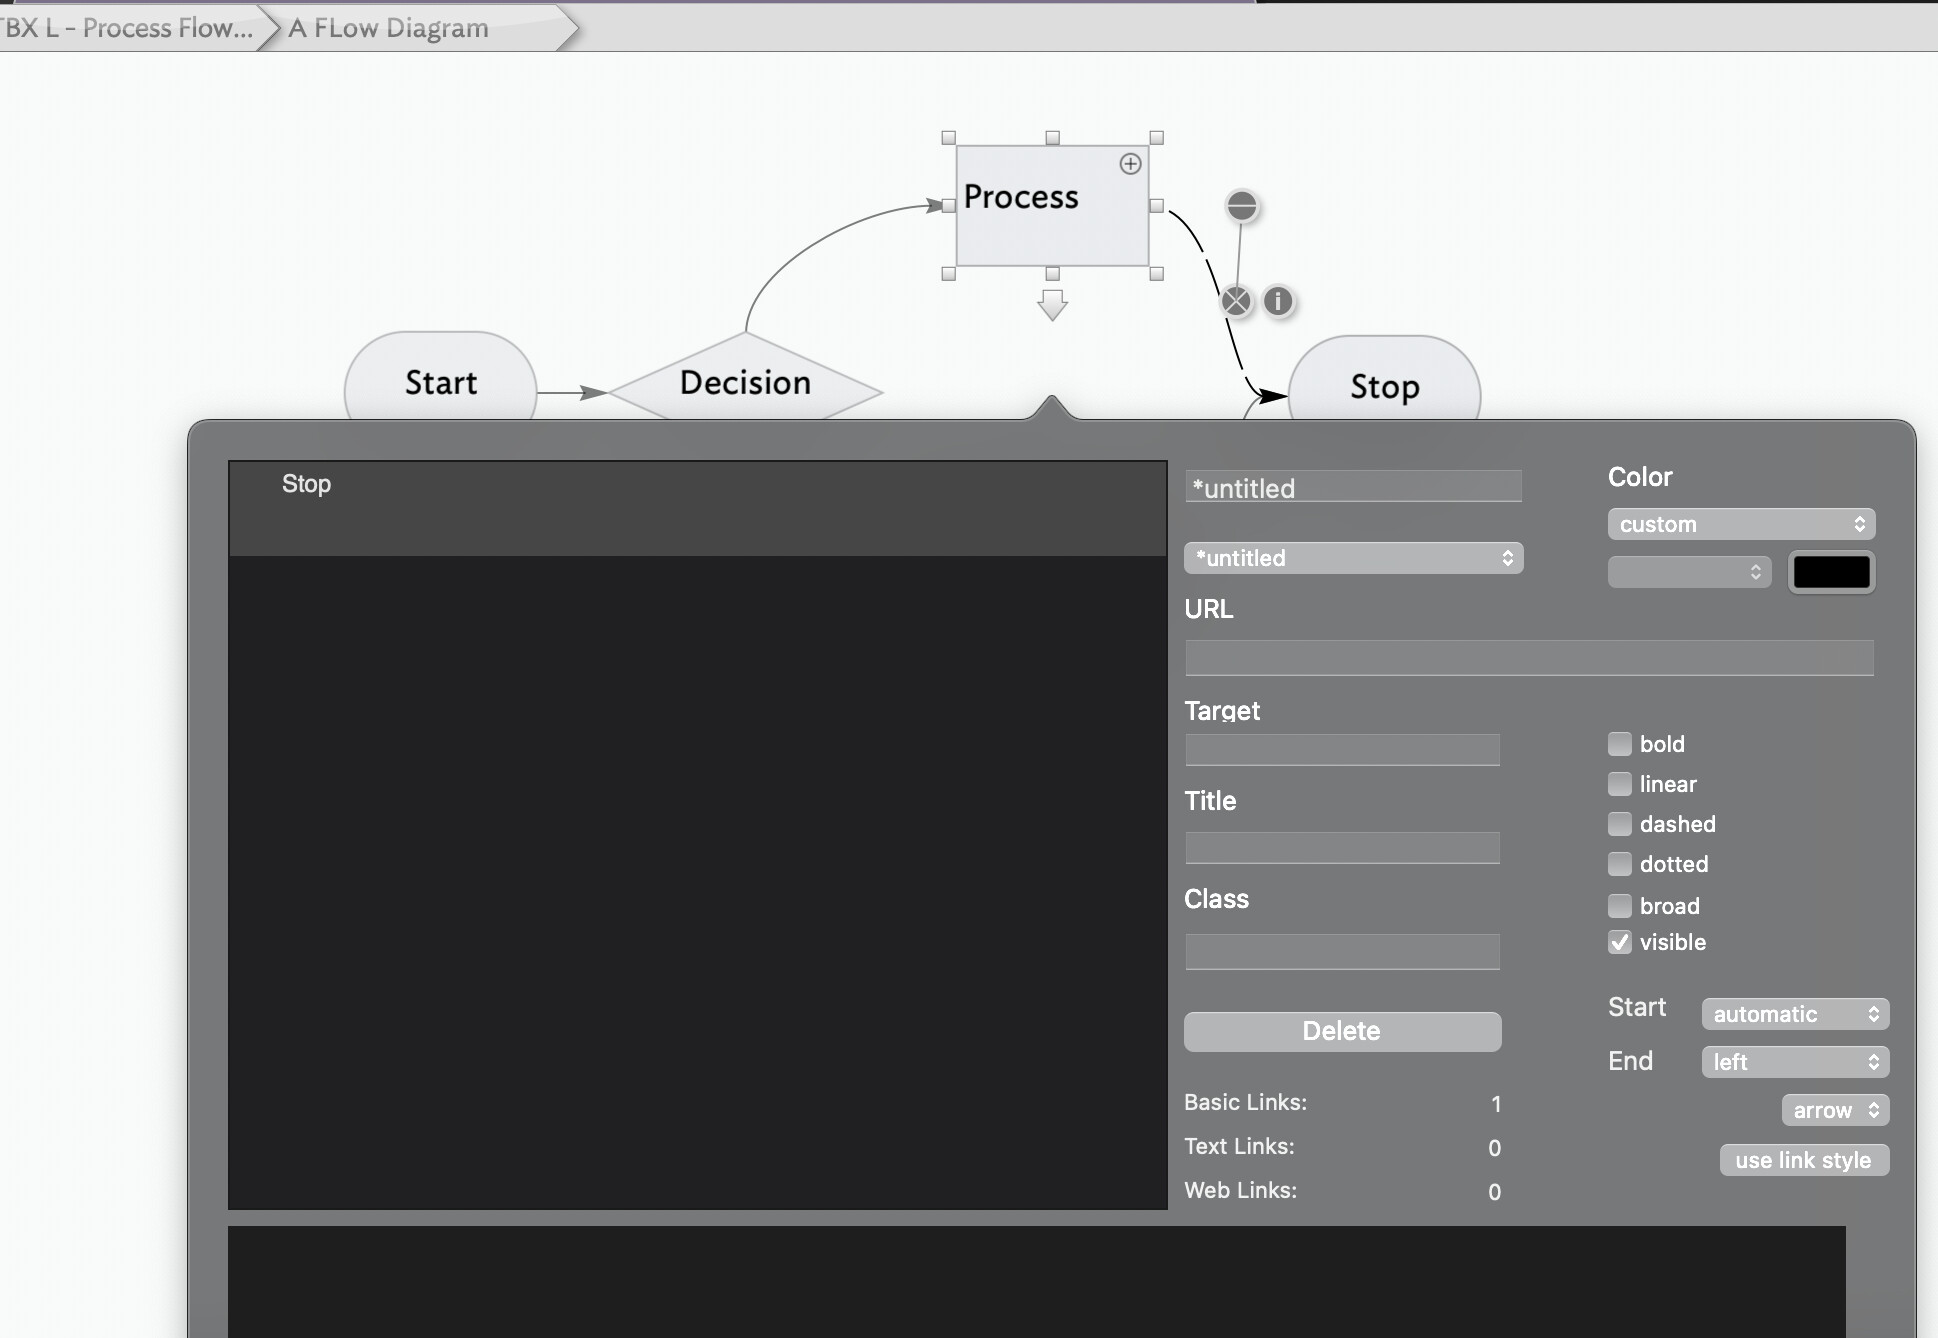
You can drag a link from its current anchor point to another anchor pad. That will help for the present.
These sorts of join/splits are interesting. As simply lines on a ‘page’ they harbour all sorts of ambiguity as to what is implicit in such a 3-way junction. Are they just figurative or can we reason/across through them, where does the join’s metadata reside, etc.
If it’s truly just a box-and-line drawing, then I guess such considerations fall away and the Backstage initiative already raised can fill the visualisation gap.
In process, dataflow, network, or similar diagrams, orthogonal connections are merely conventional and not semantic. The use of right angles (the components of orthogonal connectors) in most cases makes it easier to avoid crossed-paths. But the algorithms for generating orthogonal lines are a bit more complex than generating bezier or straight lines.
If you know a good heuristic algorithm, do let me know! (I’ve wanted to do something along these lines for eons, but most of the algorithms I’ve seen are daunting, and are really intended for things like IC design or PCB layout.)
As links in a map are still Tinderbox links, the above represents, internally two discrete links from ‘Process’ A to ‘Stop’ and ‘Process’ B to 'Stop (in fact A & B being the same $Name are only discern-able via their ID ($ID or $IDString). IOW, the join is a visual-only affordance with no computable effect?
The link lines overlap at the juncture to the left of “Stop”, but in theory there are two link lines occupying the same space.
I have no idea what the term “computable affect” means in this context. Usually “computable affect” refers to modeling emotions in simulation or AI contexts, but I don’t think that’s what we’re talking about here.
Sorry, missed typo, now fixed above : affect → effect
I was referring to the outcome you get when using existing tools to traverse the graph/hypertext of the documents links. Currently, regardless of direction, all Tinderbox links are 1:1. Does ‘Process’ (B) know its link to ‘Stop’ is combined with that from ‘Process’ (A).
I’m well aware that different users use different parts of the app for different reasons. Thus for some the above is no more than a box-and-line drawing and they need not consider further. But, in the spirit of a change for one use not unduly affecting that of others I’m reflecting on the hypertextual linkage aspects of such a change. It rather depends on whether the link-join is purely decorative or has implied meaning. My hunch is it may be that latter.
I hope that helps clarify (and sorry for the confusing typo!)
A little more context for my particular ask/use case. Yes, the image I uploaded was a very loose example. Typically, the process flow or technical workflow lines depict a sequence of events (left to right in this case) versus a relationship based on hierarchy or dependency. That said, there are times when sub-processes or branches are embedded or nested in a process. So, Process A in the top swimlane could have Process A1 as a sub-process. So, based on the type of Activity/Shape (e.g., Process/Rectangle), a line may also have a hypertextual linkage, as Mark stated. Therefore, the lines can have decorative (e.g., orthogonal lines for a cleaner look) and/or implied meanings. I hope this helps.
As this “use case” is refined, I suspect it will start encroaching into or getting very close to my requested “diagram view” for process flow and architecture diagrams.